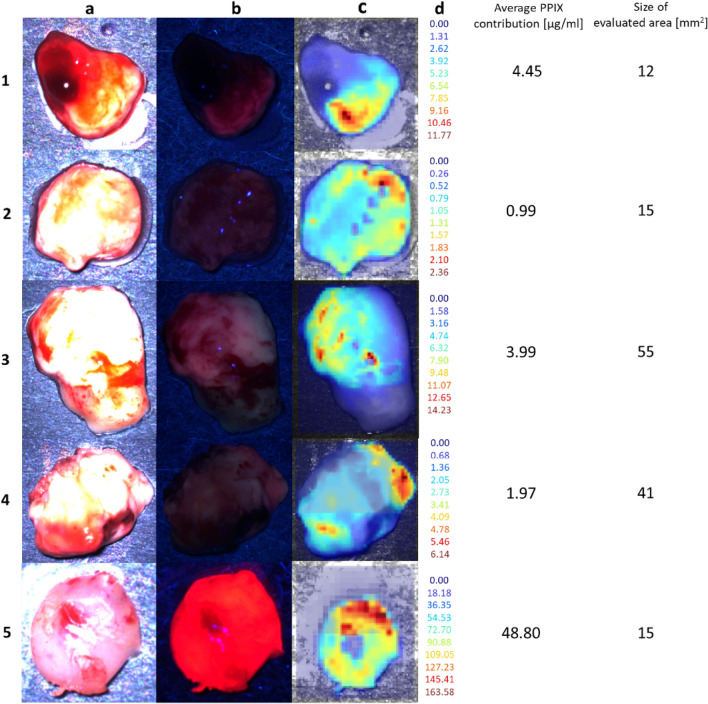
Figure 6.
Hyperspectral images of biopsies. (a) Color image, (b) BLUE 400, (c) Hyperspectral overlay, (d) PPIX contribution [µg/ml] per pixel. Average PPIX contribution [µg/ml] and the evaluated tissue area size are given. (1) IZ biopsy with no visible fluorescence in the microscope; hyperspectral measurement visualizes PPIX fluorescence and residual blood. (2) ST biopsy of small size with pixels of high reflectance and underestimated PPIX contribution. Microscope fluorescence rating was “none”, whereas, in hyperspectral imaging, weak fluorescence was visible (2b). (3 and 4) RABT samples of middle size, fluorescence quality “weak” in the microscope. Both showed heterogeneous PPIX distribution. (5) Tiny ST biopsy showing strong fluorescence in the surgical microscope and an artificially high PPIX contribution in hyperspectral measurement of up to 164 µg/ml.

