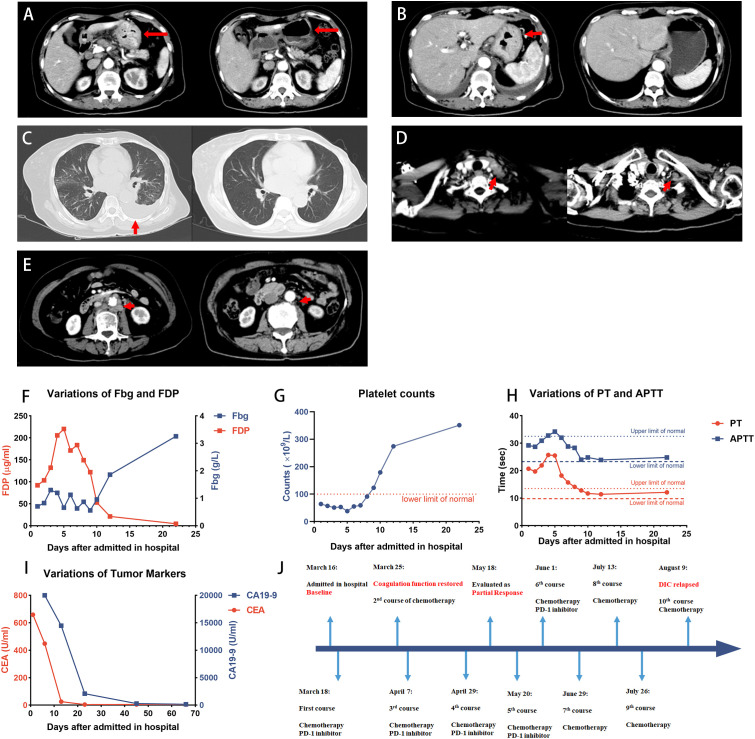
Figure 1.
Case 1 patient achieved PR after the treatment. (A–E) CT images showing the patient’s baseline disease (left panel) and response to treatment (right panel). (A, B) Diffuse thickened gastric wall significantly thinned after the treatment. (C) Pleural effusion indicated the left lung metastasis, and it was absorbed after the treatment. (D) Virchow’s nodes were slightly reduced in size. (E) Retroperitoneal lymph nodes shrunk after the treatment. (F–H) Dynamic monitoring of Fbg level, FDP, platelet counts, PT, and APTT, suggested that the coagulation function was restored. (I) Dynamic monitoring of tumor markers during the treatment. (J) Timeline of the treatment. The patient discontinued PD-1 inhibitors on 29 June and received chemotherapy only, and DIC relapsed after 2 months. PR, partial response; Fbg, fibrinogen; FDP, fibrin degradation product; PT, prothrombin time; APTT, activated partial thromboplastin time.

