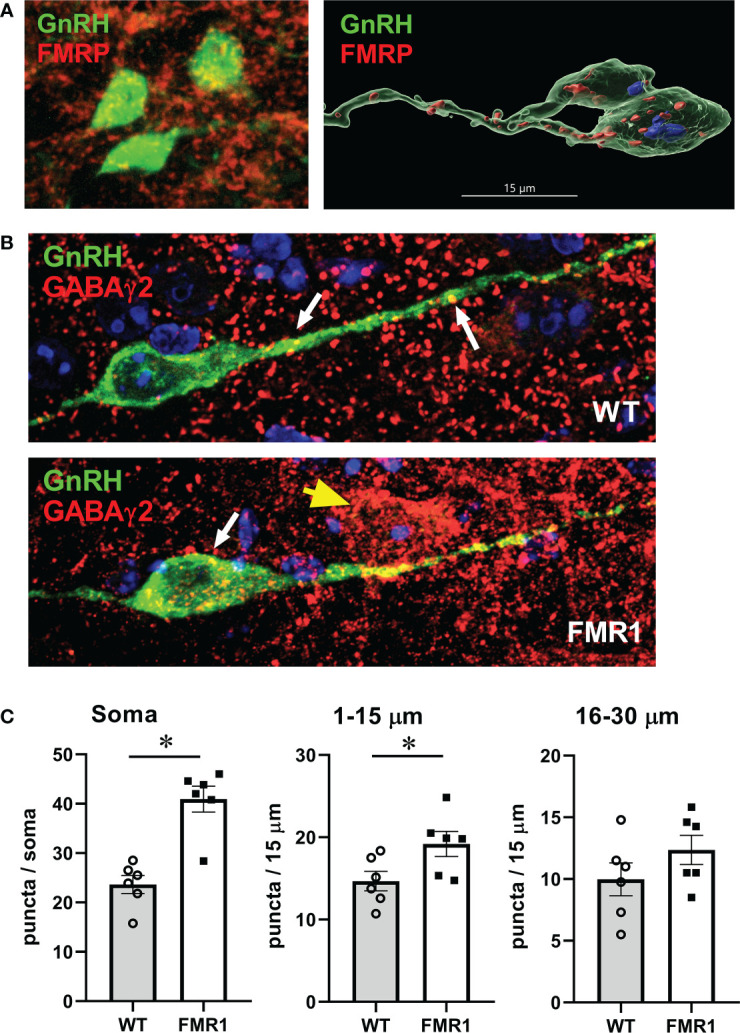
Figure 9.

GnRH neurons of Fmr1 KO females have more GABAA receptors. (A) GnRH neurons (green) express Fmrp (red, top panels). (B) Representative GnRH neurons (green) from WT control (top panel) and Fmr1 KO mice (bottom panel) co-stained with GABAγ2 antibody (red). (C) Quantification of (B) Each point represents one animals and an average of 15-20 neuron per animal, and bars represent group means. Panels represent counts in the whole soma, along the first 15 μm segment of the process (1-15 μm) and second 15 μm segment (16-30 μm) from the soma, as indicated above. Statistical significance (p < 0.05), determined with t–test followed by Tukey’s post hoc test, is indicated with a *.
