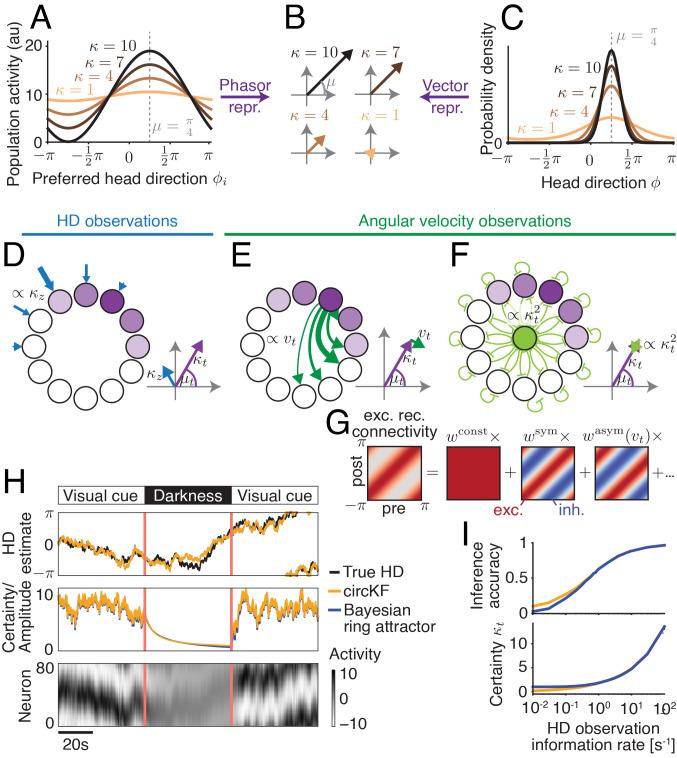
Fig. 2.
A recurrent neural network implementation of the circular Kalman filter. The HD belief vector (B; Fig. 1B) is the “vector representation” of the HD belief (C), and the “phasor representation” (obtained from linear decoding) of sinusoidal population activity (A; neurons sorted by preferred HD ϕi), here shown for HD estimate μ = π/4 (shift of activity/density) and different certainties κ (height of activity bump in A/sharpness of distribution in C). Using this duality between population activity and encoded HD belief, the circular Kalman filter can be implemented by three network motifs (D–F). (D) A cosine-shaped input to the network (strength = observation reliability κz) provides HD observation input. (E) Rotations of the HD belief vector are mediated by symmetric recurrent connectivities, whose strength is modulated by angular velocity observations. (F) Decay in amplitude, which implements decreasing HD certainty, arises from leak and global inhibition. (G) Rotation-symmetric recurrent connectivities (here, neurons are sorted according to their preferred HD) can be decomposed into constant, symmetric, asymmetric, and higher-order frequency components (here dots). (H) The dynamics of the Bayesian ring attractor implement the dynamics of the ideal observer’s belief, as shown in a simulation of a network with 80 neurons. The network received angular velocity observations (always) and HD observations (only in “visual cue” periods). (I) The Bayesian ring attractor network tracks the true HD with the same accuracy (Top; higher = lower average circular distance to true HD; 1 = perfect, 0 = random; Methods) as the circular Kalman filter (circKF, Eqs. 1 and 2) if HD observations are reliable and, therefore, more informative but with slightly lower accuracy once they become less reliable, and therefore less informative. This drop co-occurs with an overestimate in the belief’s certainty κt (Bottom). HD observation reliability is measured here by the amount of Fisher information per unit time. The accuracies and certainties shown are averages over 5,000 simulation runs (Methods for details).

