Fig. 7.
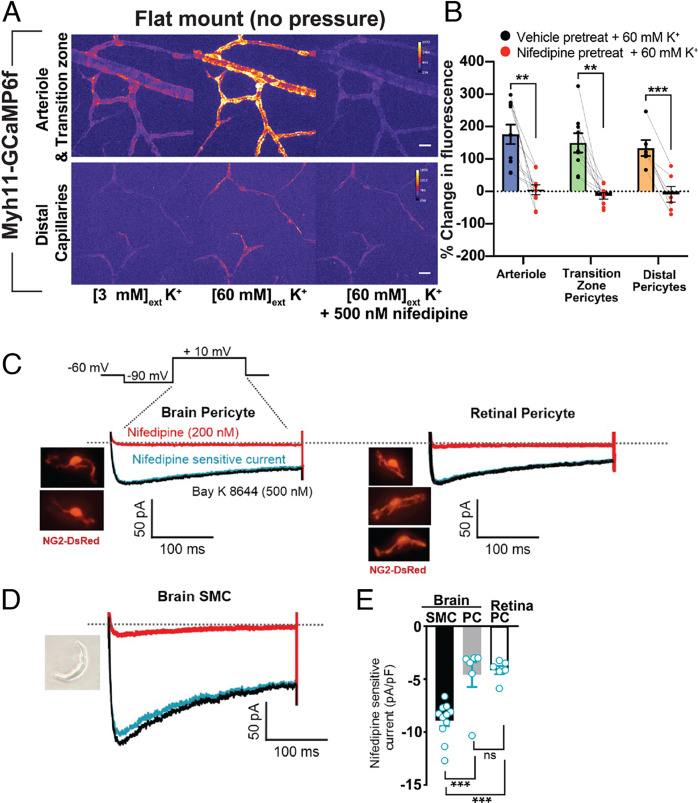
Functional expression of VDCCs in pericytes. (A) Representative pseudocolored image of GCaMP6f fluorescence in flat-mount retinal arterioles, transition zone capillaries, and distal capillaries in 3 mM external K+ (normal) 60 mM external K+, or 60 mM external K+ with pretreatment with 500 nM nifedipine. (Scale bars, 20 μm.) (B) Summary data showing Ca2+ levels (change in GCaMP6f fluorescence values) in arterioles and transition zone and distal capillaries in response to a depolarizing (60 mM) concentration of external K+ without (vehicle) and with 500 nM nifedipine pretreatment. Data are paired individual values with mean ± SEM (n = 6 to 10 vessels per zone from four to five animals; *P < 0.05, **P < 0.01, ***P < 0.001, paired t test). (C) Voltage step protocol used for all whole-cell recordings (SI Appendix, Methods). Representative images and current traces from isolated native cerebral and retinal pericytes from NG2-DsRed mice, recorded in the presence of the VDCC agonist Bay K 8644 (500 nM) or antagonist nifedipine (200 nM). Blue trace: subtracted (nifedipine-sensitive) current. (D) Representative image and current traces from isolated cerebral SMC under the same conditions as C. (E) Summary data showing current density for subtracted current conditions in isolated SMCs, brain pericytes, and retinal pericytes. Data are unpaired individual values with mean ± SEM (n = 6 to 11 per cell type from two to three animals; *P < 0.05, **P < 0.01, ***P < 0.001, Brown–Forsythe and Welch ANOVA with Welch’s correction); ns, not significant.

