Fig. 2.
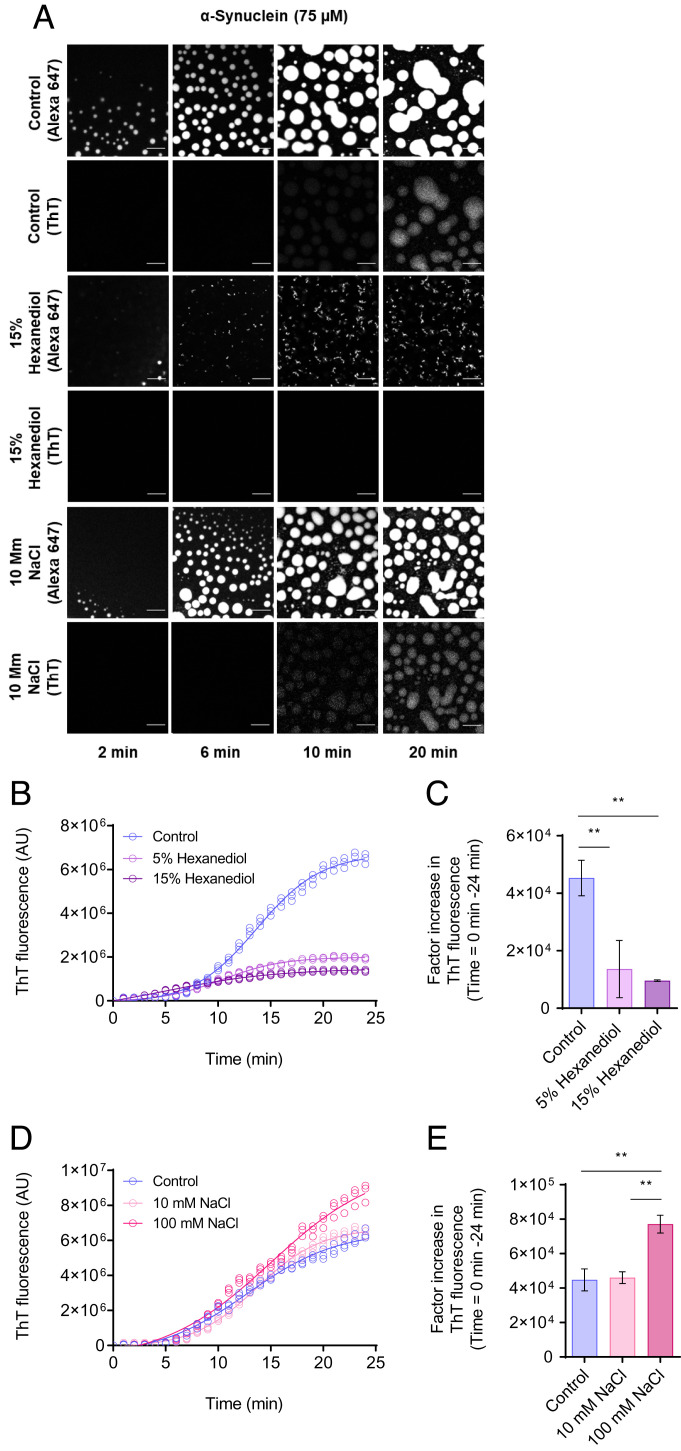
The ThT-based aggregation assay is sensitive to changes in the phase separation behavior. (A) Fluorescent images showing α-synuclein condensate formation (using Alexa Fluor 647 fluorescence) and aggregation (using ThT fluorescence) in the presence and absence (control) of 1,6-hexanediol (15% w/v), and 100 mM NaCl. The images suggest that the assay is sensitive to changes in the interactions between α-synuclein monomers as a result of 1,6-hexandiol and NaCl. (The scale bars represent 10 μm.) The images displayed represent an area of the droplet that was tracked over time. (B) Quantification of the ThT emission over time for the images shown in panel A for 75 μM α-synuclein (control) (blue) in the presence of 15% (w/v) (dark purple) and 5% (w/v) (light purple) 1,6-hexanediol over a 24-min period. (C) Factor increase in ThT fluorescence intensities from the data in panel B (the ThT intensity at 24 min was subtracted by the ThT intensity at 0 min divided by the ThT intensity at 0 min). (D) Rate of α-synuclein aggregation for the images in panel A in the presence and absence (blue) of 10 mM (light pink) and 100 mM (pink) NaCl over a 24-min period. (E) Factor increase in ThT fluorescence intensities from data in panel D (the ThT intensity at 24 min was subtracted by the ThT intensity at 0 min divided by the ThT intensity at 0 min). All experiments were performed using 75 µM α-synuclein in 50 mM Tris-HCl at pH 7.4 in the presence of 10% PEG and 20 µM ThT. The data represent mean ± SEM of n = 3 individual experiments. One-way ANOVA., *P < 0.1, **P < 0.01

