Fig. 3.
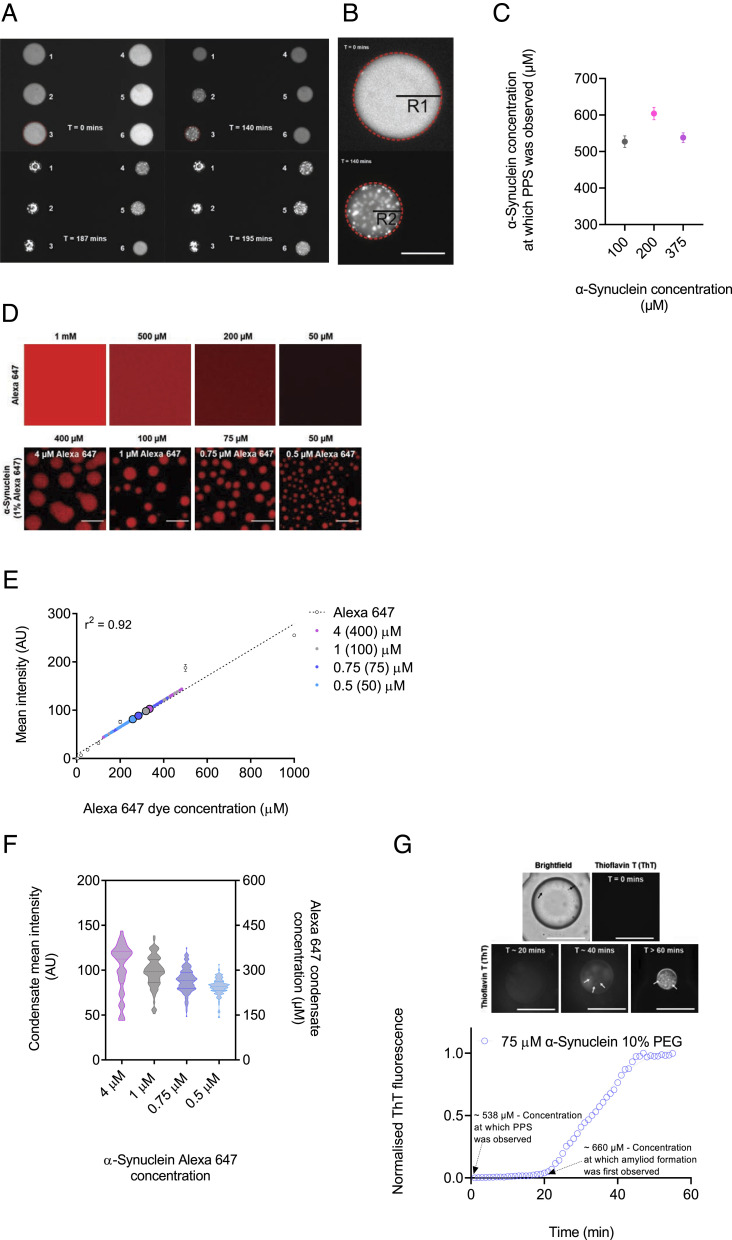
The aggregation kinetics of α-synuclein within condensates show a weak concentration dependence. Within condensates, normalized aggregation data at four α-synuclein concentrations (100, 75, 50, and 25 μM), yielded almost no variations between different concentrations (SI Appendix, Fig. S5 A and B). (A–C) The concentration required for phase separation of α-synuclein was obtained using a microfluidic device. (A) Representative fluorescence images displaying the timeline of condensate formation within several droplets (assigned a number from 1 to 6) trapped within a microfluidic chamber at 0, 140, 187, and 195 min (Movie S4). (B) Magnified image from panel C showing a droplet at the start (0 min) of the experiment and following initiation of phase separation (140 min). The concentration required for phase separation is obtained from the initial protein concentration and the change in droplet radius from the start (R1) of monitoring the droplet to the point at which phase separation is observed (R2). (The scale bar represents 50 µm.) (C) α-Synuclein concentration at which phase separation was observed within droplets as shown in panels C and D, at different initial protein concentrations (100 (gray), 200 (pink), and 100 (purple) μM) in the presence of 10% PEG, was calculated to be an average of 527, 604, and 538 μM, respectively (SI Appendix, Table S1). (D) Fluorescence images of Alexa Fluor 647 at a range of concentrations (1,000, 500, 200, and 50 μM) and images of monomeric α-synuclein (400, 100, 75, and 50 μM) condensates 10 min from the onset of phase separation. (The scale bar represents 10 µm.) (E) Fluorescence intensity of Alexa Fluor 647 from at a range of 1 to 1,000 μM from images shown in panel D was used to obtain a calibration curve of fluorescence signal for calibration (linear regression, r2 = 0.92). Small circles are the individual condensates measured for each α-synuclein concentration (n > 70 condensates per concentration), and big circles indicate the mean α-synuclein condensate intensity for each concentration [400 (light purple), 100 (gray), 75 (blue), and 50 (cyan) μM, and 4, 1, 0.75, and 0.5 μM for their respective 1% Alexa Fluor 647 protein concentration]. (F) Quantification of the mean fluorescence intensity (left Y axis) for individual condensates at each α-synuclein Alexa Fluor 647 concentrations 10 min from the onset of phase separation, and concentration within liquid droplets of α-synuclein labeled with Alexa Fluor 647 (right Y axis) at a range of bulk concentrations (400, 100, 75, and 50 μM) was estimated to be 335 ± 98, 319 ± 64, 284 ± 48 and 258 ± 34 μM after 10 min from the onset of phase separation (n > 70 condensates per concentration). (G) The concentration at which amyloid formation of α-synuclein was observed using a microfluidic device. Representative fluorescence images displaying the timeline of amyloid formation within droplet (75 μM α-synuclein, 10% PEG and 20 μM ThT) trapped within a microfluidic chamber at 0, 20, 40, and >60 min post protein phase separation (PPS). The α-synuclein concentration at which phase separation was observed within droplets was calculated to be an average of 538 ± 15.9 μM, and the concentration within droplet at which amyloid formation was observed was calculated to be an average of 660 ± 21.4 μM. (The scale bar represents 50 µm.) Data are shown for a representative experiment that was repeated at least three times.

