Fig. 5.
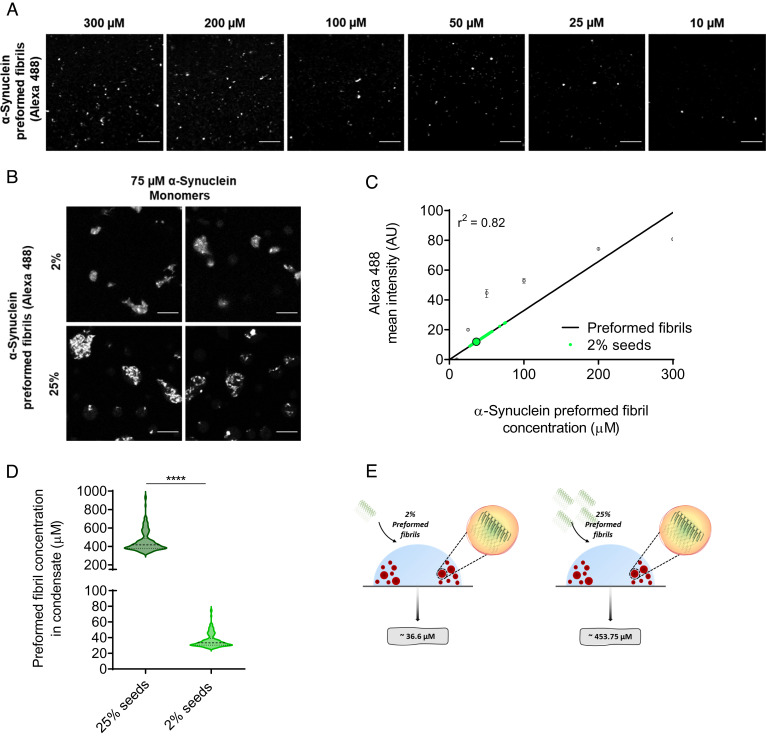
Determination of the concentration of preformed α-synuclein fibrils within α-synuclein condensates. (A) Fluorescence images of preformed α-synuclein fibrils (labeled with Alexa Fluor 488) at decreasing concentrations (300, 200, 100, 50, 25, and 10 μM). (The scale bar represents 10 µm.) (B) Representative fluorescence imaging displaying colocalization of 2% and 25% preformed fibrils (labeled with Alexa Fluor 488) within α-synuclein condensates (labeled with Alexa Fluor 647) 10 min post phase separation. (The scale bar represents 10 µm.) (C) The data reported in panel A were used for the calibration of the Alexa Fluor 488 fluorescence signal (linear regression, r2 = 0.82). The small circles are the individual condensates (n > 100) measured 10 min from the onset of phase separation and the big circle indicates the mean intensity of all fluorescently labeled preformed α-synuclein fibril within condensates. The Alexa Fluor 488 fluorescence signal of condensates in the assay containing 25% preformed fibrils had a higher intensity than the intensity of 300 μM preformed fibrils used for the calibration curve. (D) The average concentration of 2% (1.5 μM) and 25% (18.75 μM) preformed α-synuclein fibrils (labeled with Alexa Fluor 488) within α-synuclein condensates (75 μM) was estimated as 36 μM (SD = ±9, Min = 27, Max = 75 μM) and 454 μM (SD = ±112, Min = 341, Max = 939 μM), respectively. The results refer to 10 min from the onset of phase separation (n > 100 condensates). (E) Schematic illustrating the total concentration of preformed α-synuclein fibrils within condensates to be approximately 36.3 and 453.75 µM for 2% and 25% seeds, respectively. Data are from a representative experiment repeated three times with similar results. All seeded aggregation experiments were performed in 50 mM Tris-HCl (pH 7.4) and 10% PEG. The results are shown as mean ± SEM. One-way ANOVA; ****P ≤ 0.0001.

