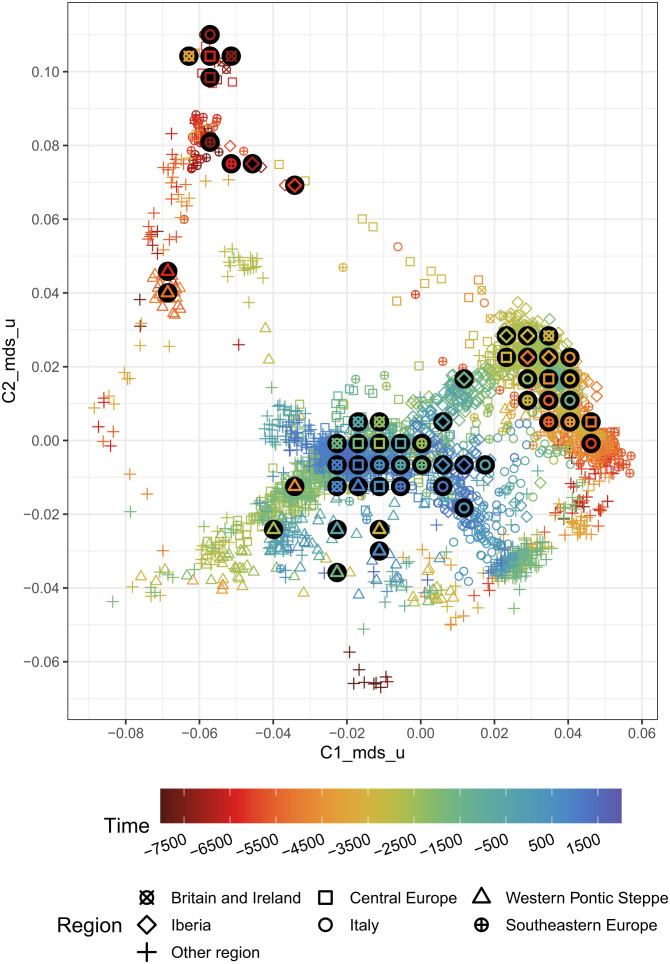
Fig. 2.
Scatter plot of the sample distribution in 2D multidimensional scaling (MDS) space. Each sample is plotted with the same shape and color as in Fig. 1. The bigger, black circles are the centroids of region-time groups (bin width = 1,000 y). To prevent overplotting, the centroids are not printed on their exact positions, but instead rearranged in a nonoverlapping lattice. SI Appendix, Text 1 for an explanation of what *_mds_u exactly entails, SI Appendix, Fig. S1 for a larger version where the individuals mentioned in the text are highlighted, and SI Appendix, Fig. S4 for a comparable PCA5 plot.

