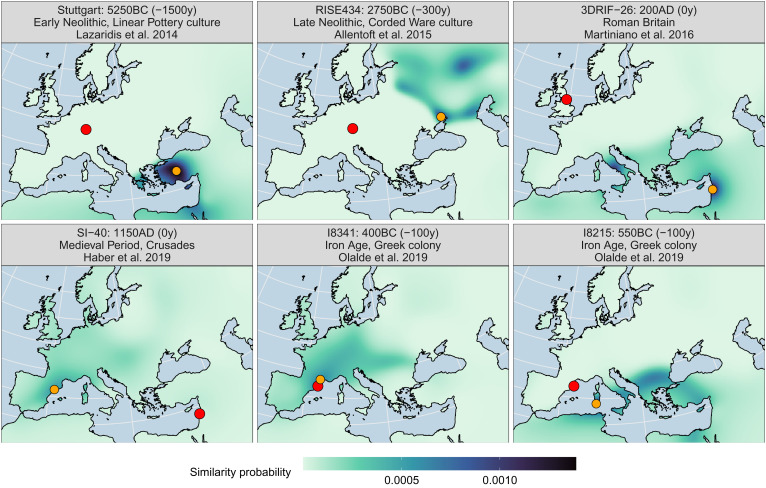
Fig. 4.
Genetic similarity probability maps for six selected individuals (resolution = 30 km). The larger red dots show their sampling/burial location, and the smaller orange dots the point of maximum probability. The facet labels feature a sample’s identifier, its approximate age, the retrospection distance applied for the search (in parentheses), a general period or context, and the publication where the sample was first discussed. SI Appendix, Figs. S8 and S9 for a comparable version of this plot for Projection PCA, which also breaks down the effect of individual output dimensions (C1–C10) for the overall result.

