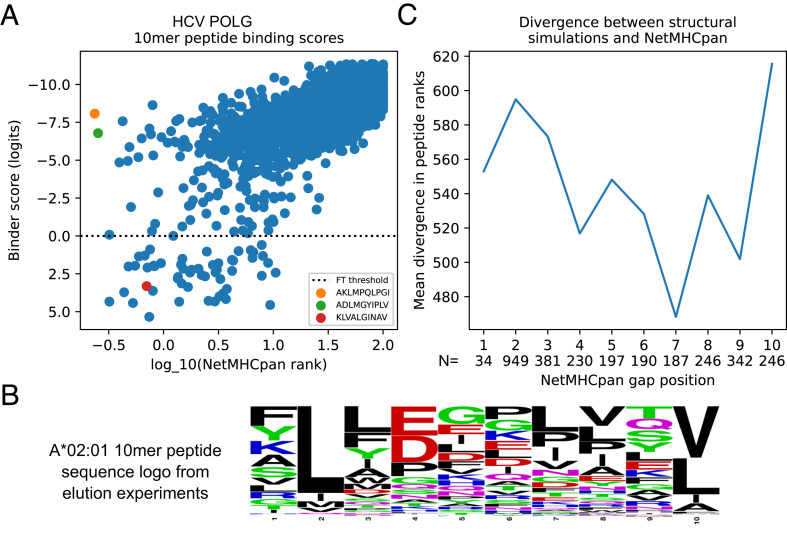
Fig. 3.
Prediction of 10-mer peptide binding highlights differences between sequence- and structure-based approaches. (A) Scatterplot of NetMHCpan rank score (x-axis, log10-transformed) versus combined structure prediction-classification model binder score (y-axis, reversed so that predicted strong binders for both methods are in the lower left) reveals strong overall correlation (R2 = 0.49) as well as peptides with divergent predictions (upper left and lower right corners). The top two NetMHCpan predicted peptides (orange and green markers) have charged amino acids at the first anchor position (peptide position 2). A known immunodominant T cell epitope (red marker) scores well by both methods. (B) Sequence logo built from 10-mer peptides eluted from A*02:01 (5) shows strong preference for hydrophobic amino acids at the anchor positions. (C) Average disagreement in peptide rank between NetMHCpan and the structural model (y-axis) is highest when the NetMHCpan gap position is located at one of the two anchor positions (2 and 10).

