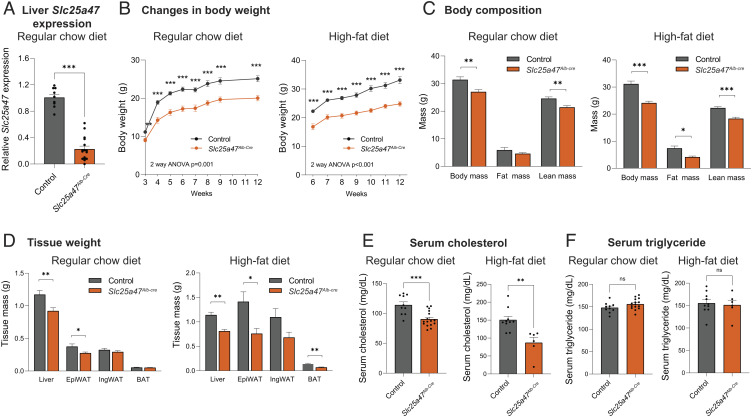
Fig. 2.
Metabolic characterization of liver-specific SLC25A47 deletion mice. (A) Relative liver Slc25a47 mRNA levels in Slc25a47Alb-Cre (n = 10) and littermate controls (n = 6). (B) Changes in body weight of Slc25a47Alb-Cre mice and control on a regular chow diet and on a high-fat diet. Regular chow diet; n = 16 for Slc25a47Alb-Cre, n = 10 for controls. High-fat diet; n = 6 for Slc25a47Alb-Cre, n = 11 for controls. P-value determined by two-way ANOVA followed by unpaired Student’s t test. (C) Body composition of mice at 16 wk of regular chow diet and at 6 wk of high-fat diet. Regular chow diet; n = 11 for Slc25a47Alb-Cre, n = 10 for controls. High-fat diet; n = 6 for Slc25a47Alb-Cre, n = 11 for controls. (D) Indicated tissue weight of mice in (B). (E) Serum cholesterol levels of mice at 12 wk of age on a regular chow diet and after 6 wk of high-fat diet. Regular chow diet; n = 16 for Slc25a47Alb-Cre, n = 10 for controls. High-fat diet; n = 6 for Slc25a47Alb-Cre, n = 10 for controls. (F) Serum TG levels of mice in (E). ns, not significant. A–E, *P < 0.05, **P < 0.01, ***P < 0.001 by unpaired Student’s t test.

