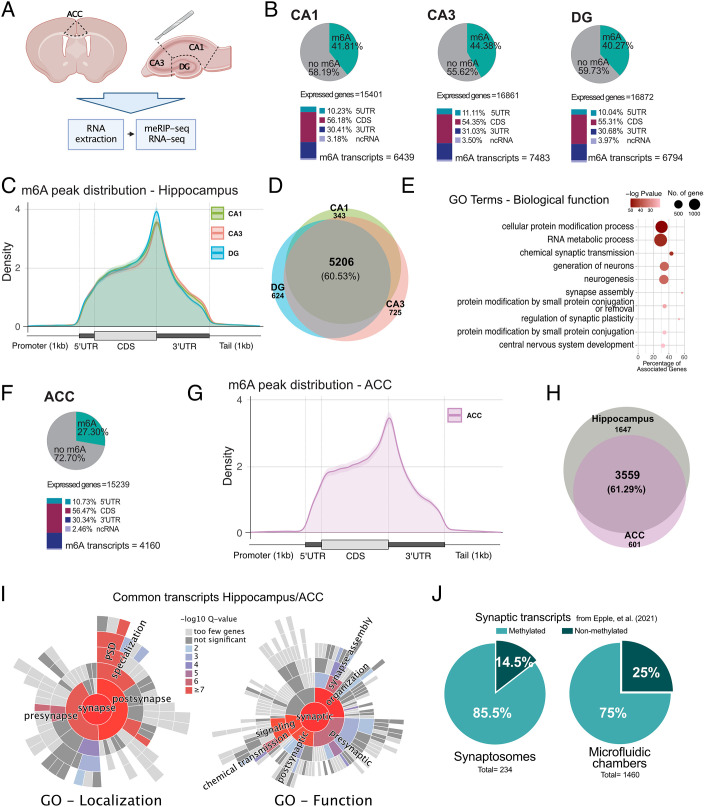
Fig. 1.
The m6A epitranscriptome in the adult mouse brain. (A) Experimental scheme. (B) Upper: Pie chart showing the percentage of m6A methylated transcripts in the hippocampal CA1, CA3, and DG regions when calculated against the corresponding input. Lower: m6A peak location is shown for the annotated transcript regions. The percentages are calculated from the total number of m6A peaks. (C) Guitar plot showing the distribution of m6A peaks along mRNAs in the hippocampal subregions. (D) Venn diagram comparing m6A methylated transcripts across hippocampal subregions. (E) GO term (biological function) analysis of the m6A methylated transcripts commonly detected in all hippocampal regions.(G) Guitar plot showing the distribution of m6A peaks along mRNAs in the ACC. (F) Upper: Distribution of m6A RNA methylation across the transcriptome in the ACC. Lower: m6A peak location is shown for the annotated transcript regions. The percentages are calculated from the total number of m6A peaks. (H) Venn diagram comparing m6A commonly methylated transcripts in the hippocampus and ACC. (I) Sunburst plots showing the enrichment of synapse-specific GO terms within commonly m6A methylated transcripts in the hippocampus and ACC. (J) Pie chart showing the percentage of m6A methylated transcripts within RNA-seq datasets obtained from hippocampal synaptosomes or synapses isolated from microfluidic chambers. ACC - anterior cingulate cortex, DG - dentate gyrus, 5UTR - 5′ untranslated region, 3UTR - 3′ untranslated region, CDS - coding sequence, ncRNA - noncoding RNA.

