Fig. 2.
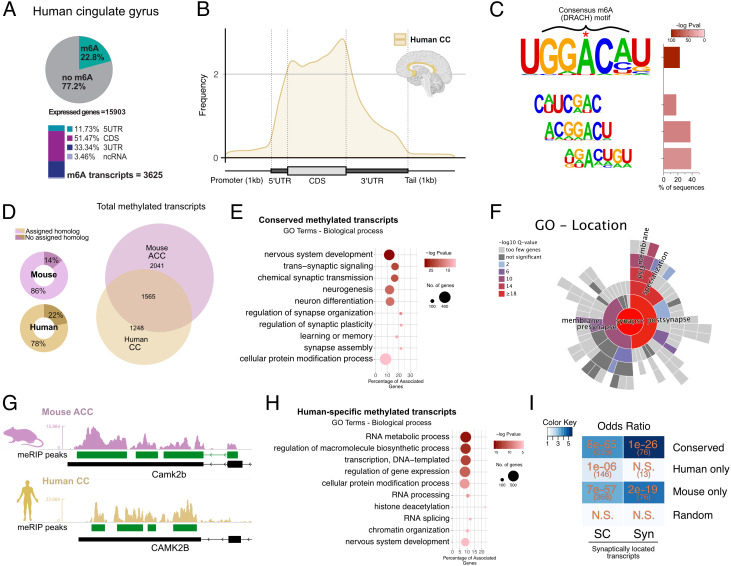
Conserved m6A modifications between mouse and human. (A) Upper: Pie chart showing the percentage of m6A methylated transcripts in the human CC calculated against the corresponding input. Lower: m6A peak location is shown for the annotated transcript regions. The percentages are calculated from the total number of m6A peaks. (B) Guitar plot showing the distribution of m6A modifications along mRNAs in the human CC. (C) Motif analysis within the m6A peaks identifies the m6A DRACH consensus motif (D = A, T, or G, R = A or G, and H = A, T, or C). (D) Left: Doughnut chart showing the mouse/human genes with known homologues in human/mouse, respectively, that were used to compare methylated transcripts across species. Right: Venn diagram comparing m6A methylated homologue transcripts in the adult mouse ACC to the human CC. (E) GO categories (biological process) for m6A methylated transcripts common to the mouse ACC and human CC. (F) Sunburst plot showing synapse-specific location GO term enrichment for m6A methylated transcripts common to the mouse ACC and human CC. (G) Representative coverage tracks showing conserved m6A modifications along the 3′ end of homologous transcripts, in this case Camk2b in the mouse ACC and human CC (CAMKIIb/CAMKIIB). Tracks show coverage values for m6A-RIP normalized for the corresponding inputs and library size. Scale in RPM. (H) GO categories (biological process) detected when m6A methylated transcripts specific to the human CC are analyzed. (I) Heat map showing the odds ratio for the association between conserved transcripts (commonly detected in mice and humans) and human- and mouse-specific transcripts in comparison to synaptic RNAs, as published in ref. 34. Color scale represents the numerical value of enrichment (odds ratio), numbers in orange correspond to the P value for the corresponding overlap, and numbers in parentheses refer to the number of overlapping genes. N.S. = not significant. SC = RNAs detected in the synaptic compartments of microfluidic chambers; Syn = RNAs detected in synaptosomes (34). Random corresponds to 2,000 randomly selected brain-expressed human genes. ACC - anterior cingulate cortex, CC - cingulate cortex.

