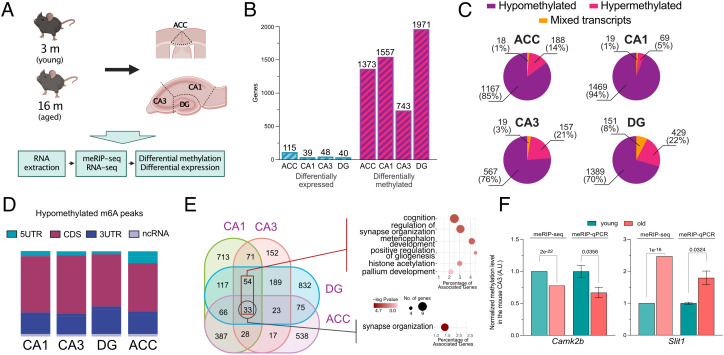
Fig. 3.
Tissue-specific m6A changes in the aging mouse brain. (A) Experimental scheme. (B) Bar graph showing the number of differentially expressed and differentially methylated genes detected in the corresponding brain subregion, applying equal cutoffs for FC and adjusted P value (FC > 1.2 and padj ≤ 0.05). (C) Pie charts showing the proportion of methylated transcripts containing peaks with only reduced methylation levels in aging (hypomethylated) and only increased methylation (hypermethylated) or a mixture of decreased and increased (mixed) m6A peaks in the analyzed brain subregions. (D) Bar chart showing the annotated distribution of significantly hypomethylated m6A peaks across transcripts for the investigated brain regions. (E) Venn diagram comparing the hypomethylated transcripts across hippocampal subregions and the ACC. The dark red rectangle refers to the 87 transcripts detected in all hippocampal subregions. The corresponding Right/Upper panel shows the GO term (biological process) analysis for these transcripts. The black rectangle refers to the 33 transcripts commonly hypomethylated in the hippocampus and ACC, and the Right/Lower panel shows the corresponding GO term analysis. (F) qPCR validation of two differentially methylated genes (hypo- and hypermethylation). The graphs show the FC in methylation as detected by meRIP-seq and meRIP–qPCR. For the meRIP-Seq side, columns show the mean FC with the FDR displayed above, as calculated by ExomePeak. For the qPCR data, the columns show the mean ± SEM of four independent replicates per condition. Statistical significance was determined by Student’s t test, and the P value is displayed above the comparison. ACC - anterior cingulate cortex, DG - dentate gyrus, 5UTR - 5′ untranslated region, 3UTR - 3′ untranslated region, CDS - coding sequence, ncRNA - noncoding RNA.

