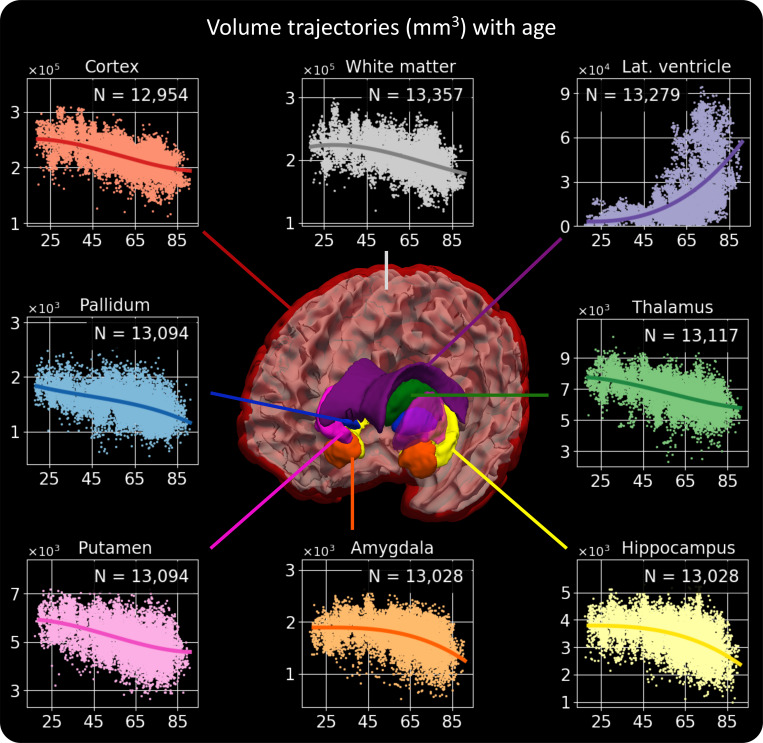
Fig. 5.
Volume trajectories obtained by processing 14,752 heterogeneous clinical scans with SynthSeg+. For each brain region, the value of N indicates the number of volumes considered to build the plot, i.e., the number of segmentations that passed the automated QC for this structure. We emphasize that the obtained results are remarkably similar to recent studies, which exclusively employed scans of much higher quality (39–41).

