
Fig. 6.
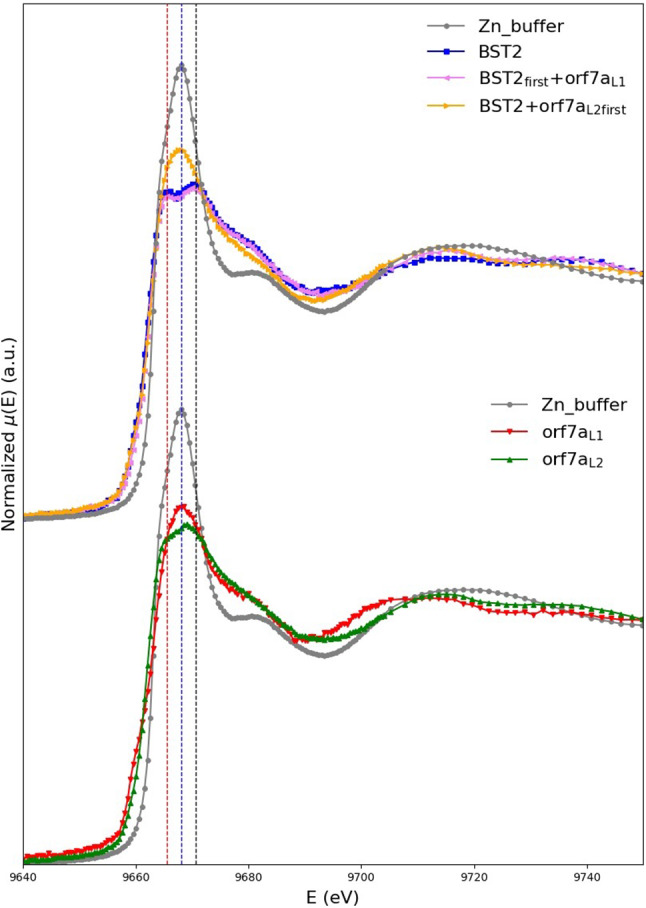
In the top panel, we compare the normalized XANES absorption coefficient of the Zn-buffer (grey curve) to that of BST2 (blue curve), (purple curve) and (orange curve). In the bottom panel, we compare the normalized XANES absorption coefficient of the Zn-buffer (grey curve) to that of (red curve) and (green curve). The central dotted line is drawn to pass through the maximum of the Zn buffer spectrum at 9668.1 eV, and the other two through the positions of the split maxima of the BST2 spectrum, located at 9665.6 and 9670.6 eV, respectively. The figure is taken from [1]