
Figure 4. Time-resolved SAXS of the nucleotide-binding domain (NBD) of Ec MsbA.
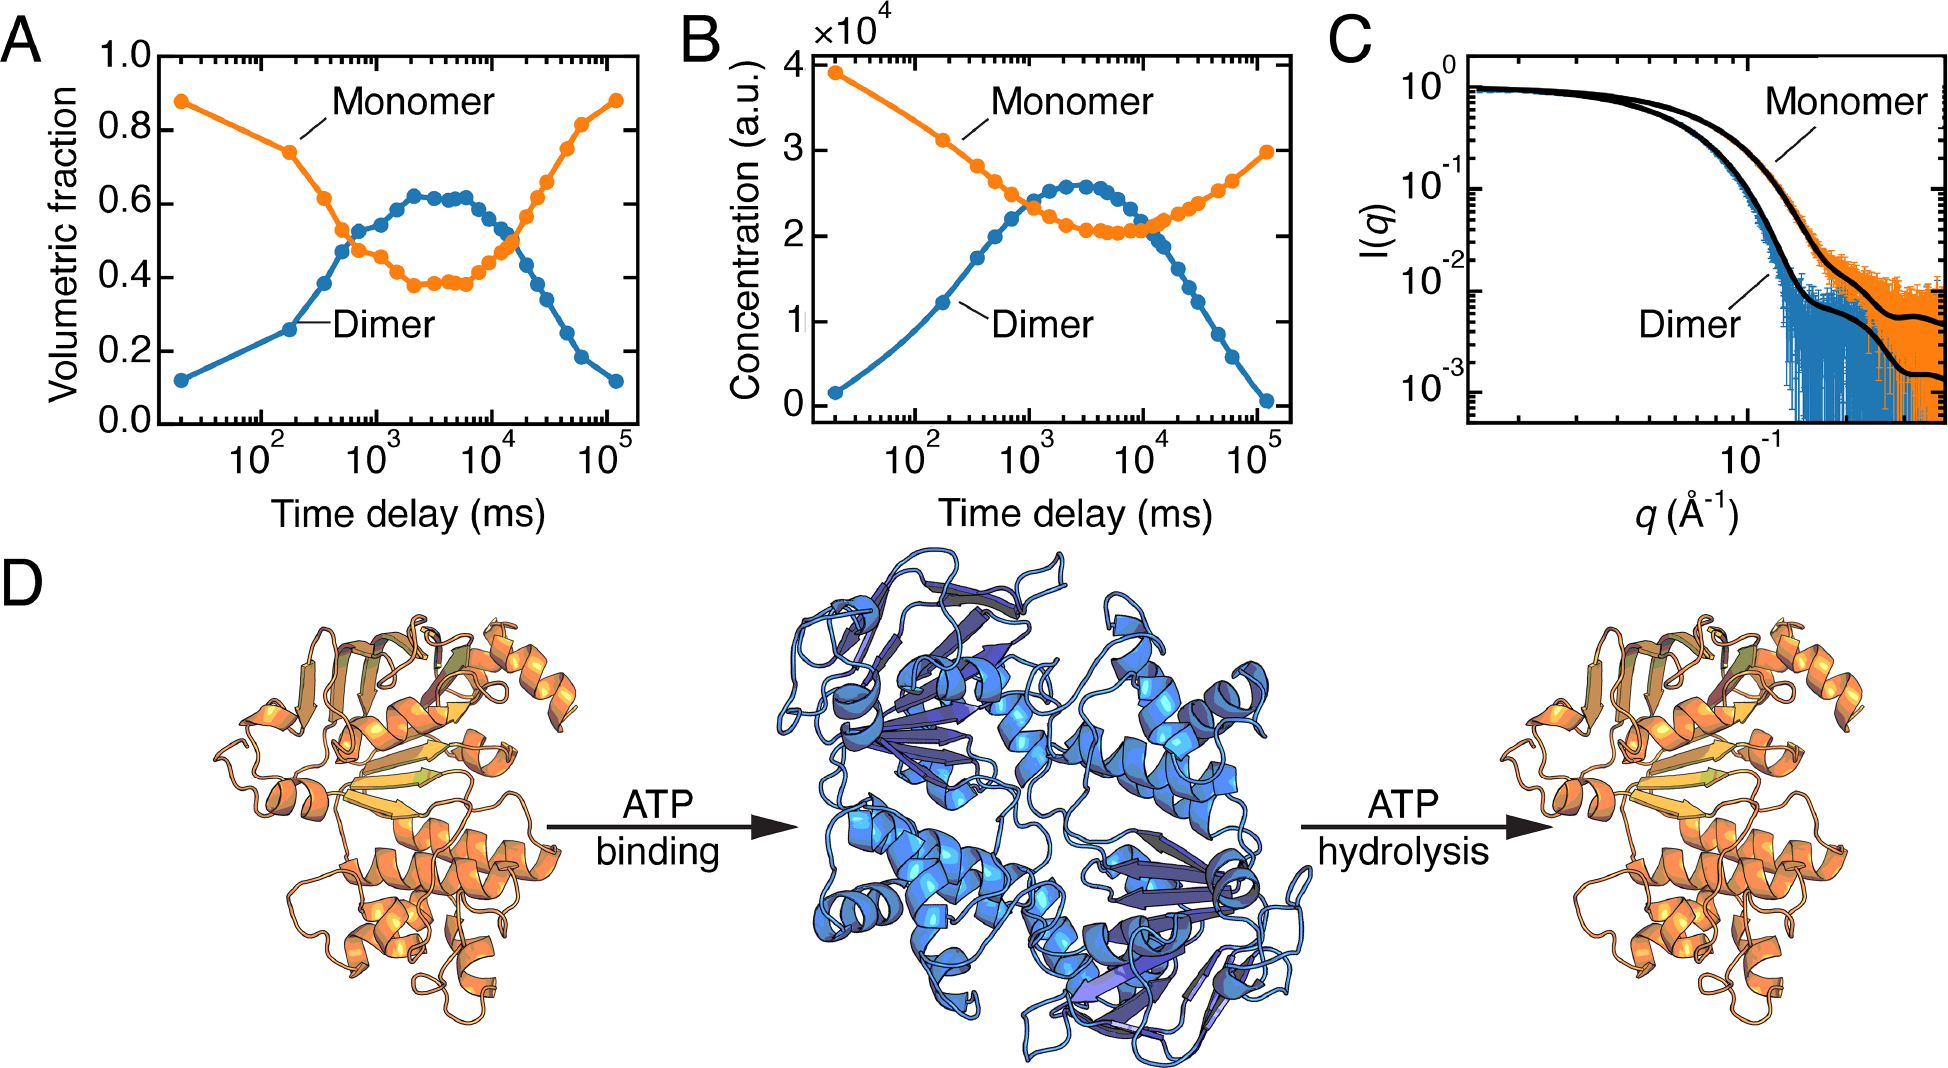
A) Concentrations of individual species obtained by fitting linear combinations of the theoretical SAXS profiles calculated from models of the monomer and dimer derived from a crystal structure (PDB: 3B60).[39] Figure was reproduced from the original data (SASDB entry: SASDGV5) following the methods in the original paper. B) Concentrations derived from REGALS are in agreement with panel A. C) SAXS profiles of the monomer and dimer of Ec MsbA-NBD extracted from the time-resolved experiment by REGALS agree with CRYSOL predictions from the models described in panel A. Panels B, C: adapted under Attribution 4.0 International (CC BY 4.0) license [5]. D) Illustration of the transition between monomer and dimer during ATP binding and hydrolysis, generated via AlphaFold2 from the sequence of Ec MsbA-NBD (residues 337–582).