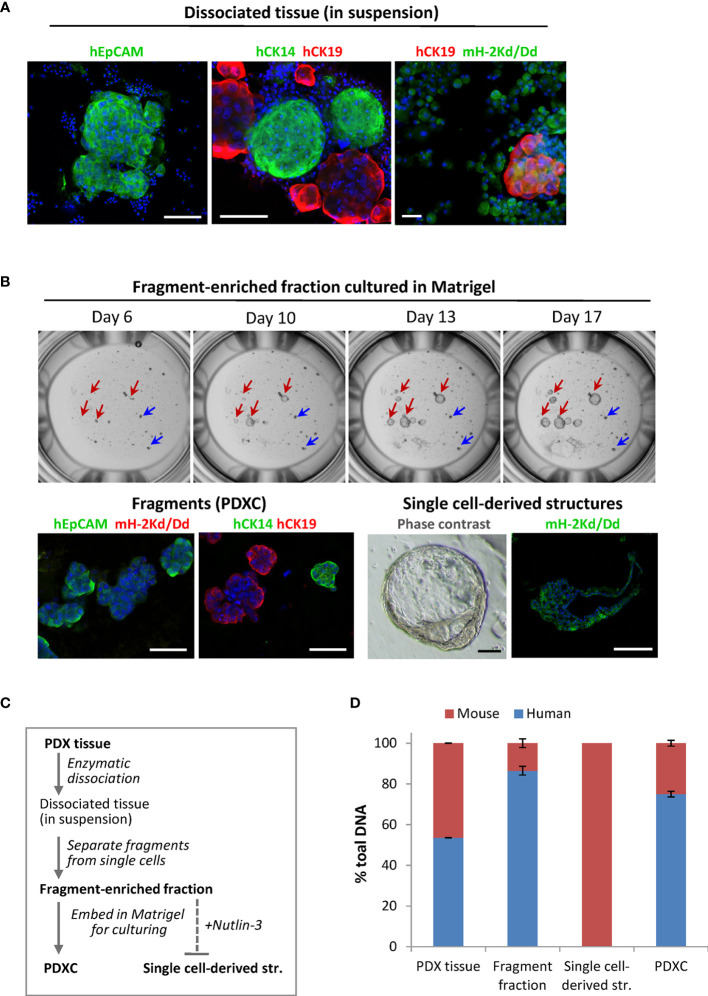
Figure 3.
The composition of the dissociated MAS98.12/MAS98.12PR PDXs and the ex vivo cultures. (A) IF staining of the dissociated PDX tissue suspension with human EpCAM, CK14 and CK19, and mouse H-2Kd/Dd; scale bars, 100 μm. (B) Cultures established from fragment-enriched fraction embedded in Matrigel. Upper panel: phase contrast pictures taken over time, where fragments and single cell-derived structures are shown by blue and red arrows, respectively. Lower panel: IF staining with human EpCAM, CK14 and CK19 and mouse H-2Kd of fragments and single cell-derived structures; DAPI stains the nucleus; scale bars, 100 μm. (C) The scheme indicating preparation of the samples discussed in the figure; bold indicates the samples whose DNA composition was analyzed by species-specific qPCR and presented in (D); (D) Quantitative assessment of human and mouse DNA content in the different samples; average ± StDv (n=2, here represented by one sample from each PDX).

