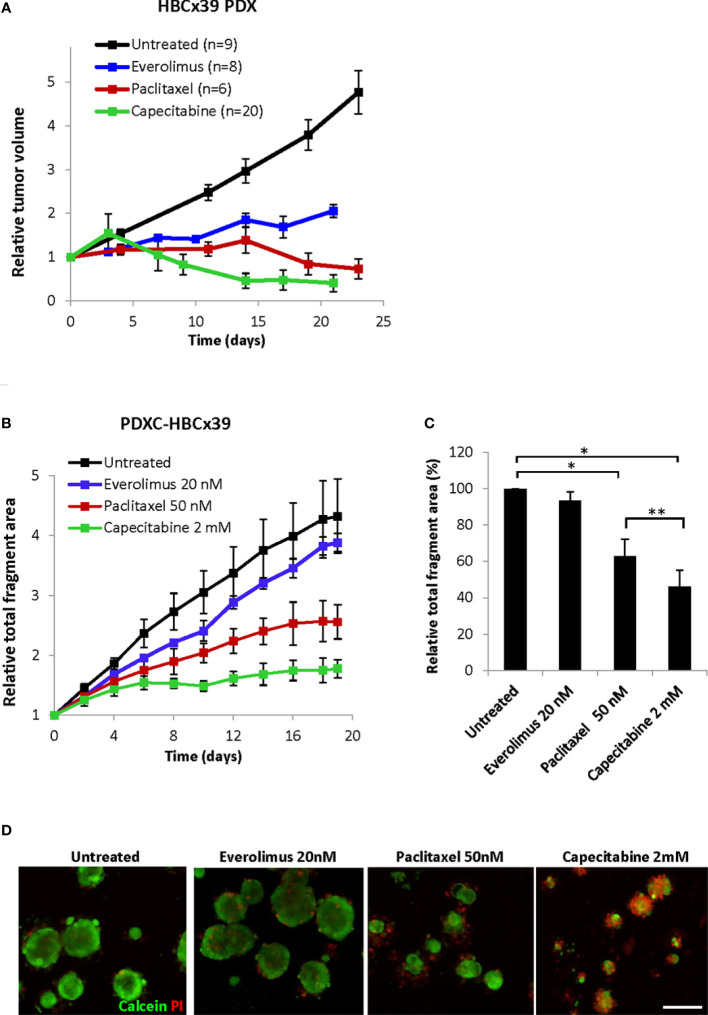
Figure 7.
Response of HBCx39 PDX and PDXC to paclitaxel, capecitabine and everolimus. (A) Relative tumor volume (normalized to the volume at the day when the treatment was started) of non-treated and treated HBCx39 PDX; the treatment was as follows: paclitaxel (15 mg/kg, 2x/week), capecitabine (755 mg/kg, 5x/week) and everolimus (5 mg/kg, 5x/week). (B) Relative total fragment area normalized to the area at the start of the treatment; average ± StDv (3-4 parallels for each condition in one representative experiment). (C) The total fragment area in the treated cultures (day 19) shown as a percentage of the untreated controls; average ± SEM (n=3 for paclitaxel and capecitabine) and ± StDv (n=2 for everolimus); * and **, p < 0.05 by unpaired and paired t-test, respectively. (D) Representative fluorescence pictures of PDXCs treated with/without the indicated drugs for 19 days before staining with calcein and PI; scale bar, 200 μm.

