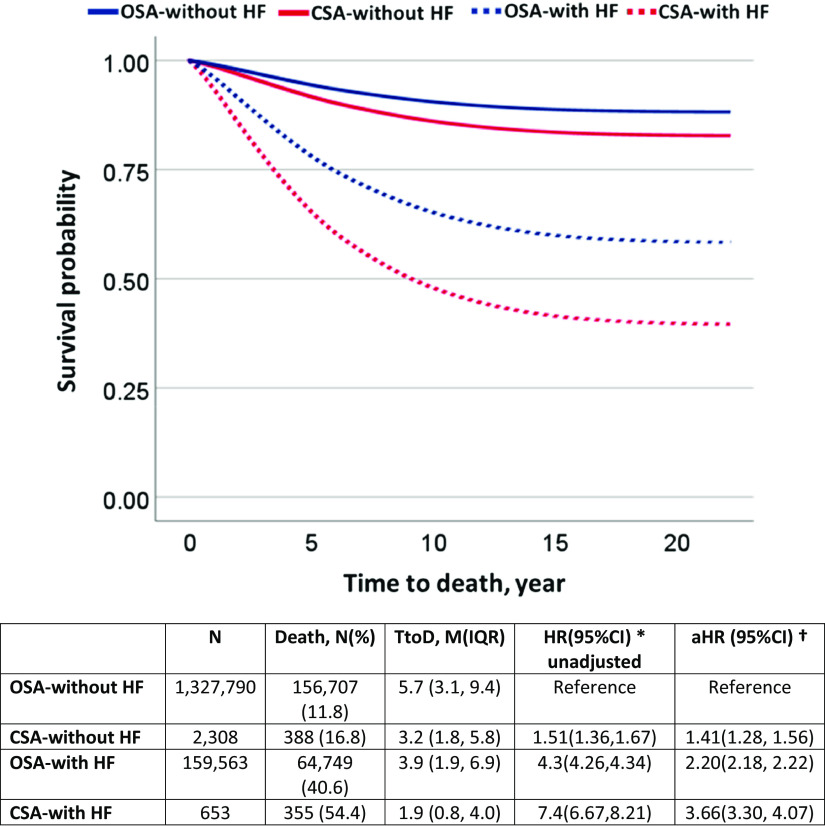
Figure 2.
Kaplan-Meier curves. Comparison of survival probability on the basis of the presence and absence of HF. *HR (95%CI) = hazard ratio 95% percent confidence intervals and †adjusted by gender, race, body mass index, age, and Charlson comorbidity index. aHR = adjusted hazard ratio; CI = confidence interval; CSA = central sleep apnea; HF = heart failure; IQR = interquartile range; M = mean; OSA = obstructive sleep apnea; TtoD = time to death.

