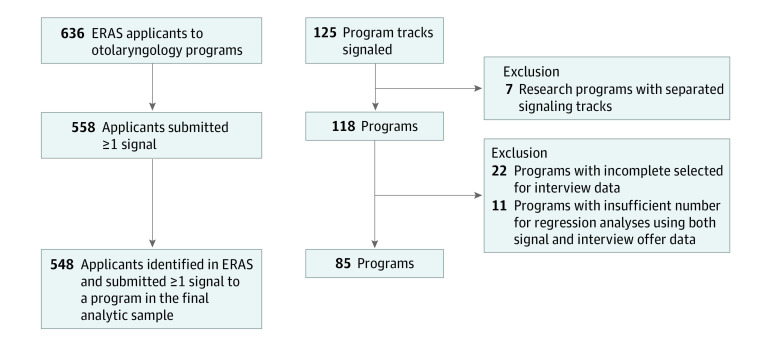
Figure 1. Flowchart of Data Selection.
A total of 636 applicants applied to 118 otolaryngology programs, resulting in 45 973 applications. The analysis sample was reduced to 548 applicants (87%) who participated in the signaling program. The final data set used for analyses represents 548 applicants (87%) and 85 programs (71%). ERAS indicates Electronic Residency Application System.

