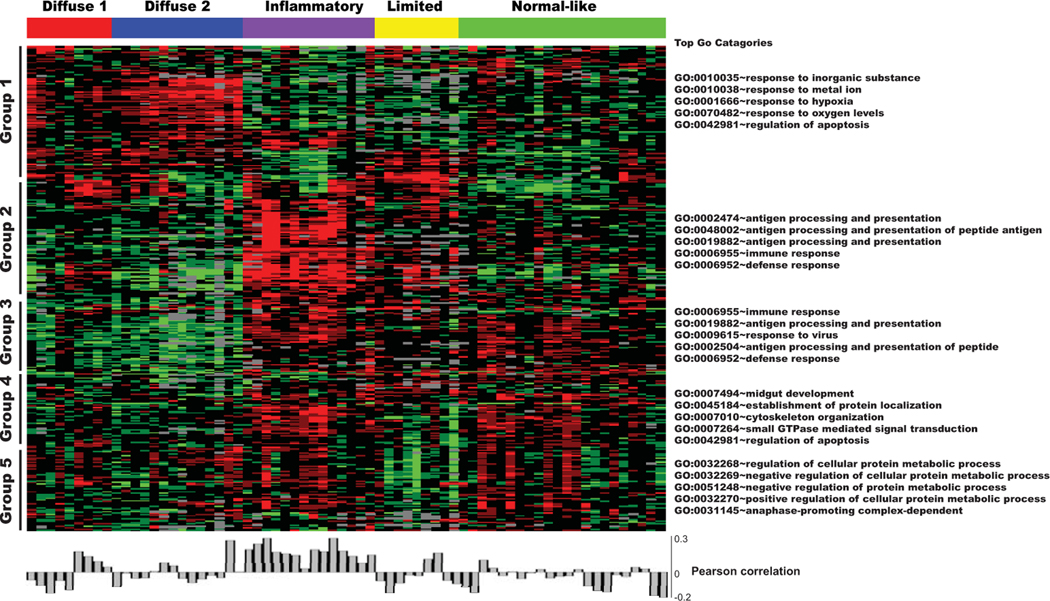
Figure 2.
TLR9-responsive gene signature in SSc skin biopsy specimens. An experimentally derived 314-gene TLR9 signature (GEO accession no. GSE30849) (23) was compared with SSc skin biopsy gene expression data (GEO accession nos. GSE9285 and GSE32413) (24,25). Heatmap shows groups of genes clustering hierarchically (black bars); the 5 most highly represented Gene Ontology (GO) terms can be seen alongside each cluster (right). Pearson’s correlation of the TLR9 gene signature in each biopsy specimen is shown below heatmap. See Figure 1 for other definitions.

