
Figure 4. Expression of αTAT1 drives increased microtubule acetylation but does not protect the microtubule network from KIF5C(1–560)-–6 destruction.
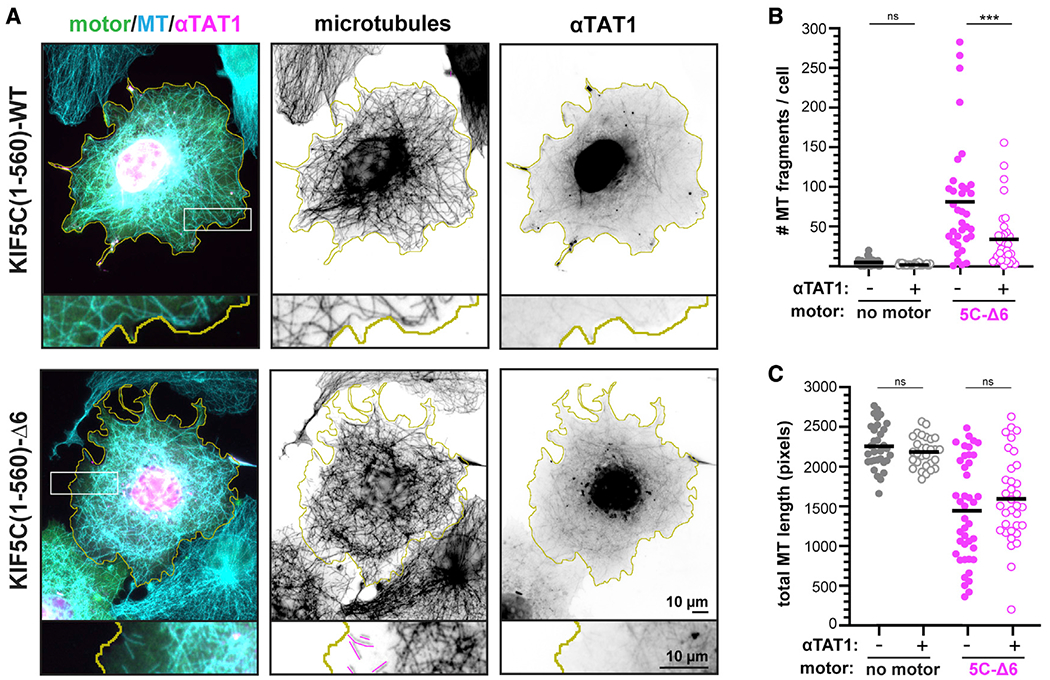
(A) Representative images of the microtubule (MT) network in cells expressing KIF5C(1–560)-WT or KIF5C(1–560)-Δ6 together with αTAT1. The cells were fixed and stained with antibodies against total β-tubulin (microtubules) or αTub-K40ac (see also Figures S6A–S6C). Yellow lines indicate the periphery of each cell, white boxes indicate regions shown below each image at higher magnification, and magenta traces indicate microtubule fragments. Scale bars, 10 μm.
(B and C) Quantification of the microtubule network. Each dot represents one cell.
(B) Number of microtubule fragments per cell.
(C) Total length of microtubules in a 100 × 100 pixel box (10.6 × 10.6 μm, 10,000 total pixels) at the cell periphery. ***p < 0.001 (Student’s t test); ns, not significant.