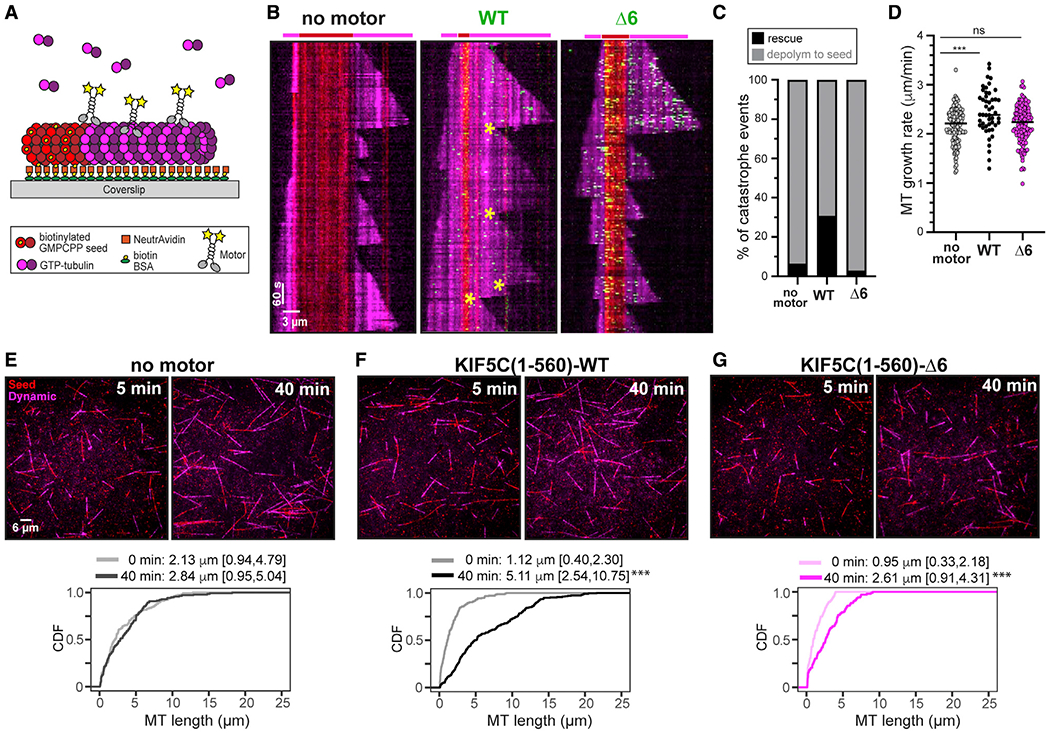
Figure 5. KIF5C(1–560)-WT but not KIF5C(1–560)-Δ6 promotes microtubule rescue and overall microtubule growth.

(A) Schematic of microtubule dynamics assay. Microtubules were polymerized from biotinylated GMPCPP-tubulin seeds in the presence of 10.7 μM tubulin and in the absence of motor or presence of 36 nM 3xmCit-tagged KIF5C(1–560)-WT or KIF5C(1–560)-Δ6 motors.
(B) Representative kymographs. Red, biotinylated GMPCPP microtubule seeds; magenta, dynamic microtubules; green, KIF5C motors. Time is displayed on the y axis (scale bars, 60 s) and distance on the x axis (scale bars, 3 μm). Yellow asterisks mark rescue events.
(C and D) Quantification of (C) frequency of microtubule rescue and (D) microtubule growth rates.
(C) From videos of dynamic microtubules, events were scored as a catastrophe followed by depolymerization to the GMPCPP seed (gray) or catastrophe followed by a rescue event and new microtubule growth (black). N > 170 microtubules for each condition across two independent trials.
(D) Each spot indicates a microtubule growth event. No motor, 2.16 ± 0.36 μm/min (mean ± SD); WT, 2.45 ± 0.46 μm/min; Δ6, 2.20 ± 0.39 μm/min. ***p < 0.0001 (Tukey’s multiple comparisons test). See also Figures S1E–S1G.
(E–G) Representative images at 5 and 40 min time points. Red, GMPCPP seeds; magenta, dynamic microtubules. Scale bars, 6 μm. Graphs display cumulative distribution functions (CDFs) of microtubule lengths at the beginning (0 min) and end (40 min) of the assay. n > 102 each microtubules across two independent trials. Data reported as median [quartiles]. ***p < 0.001 as compared with the 0 min time point (Kolmogorov-Smirnov test).
