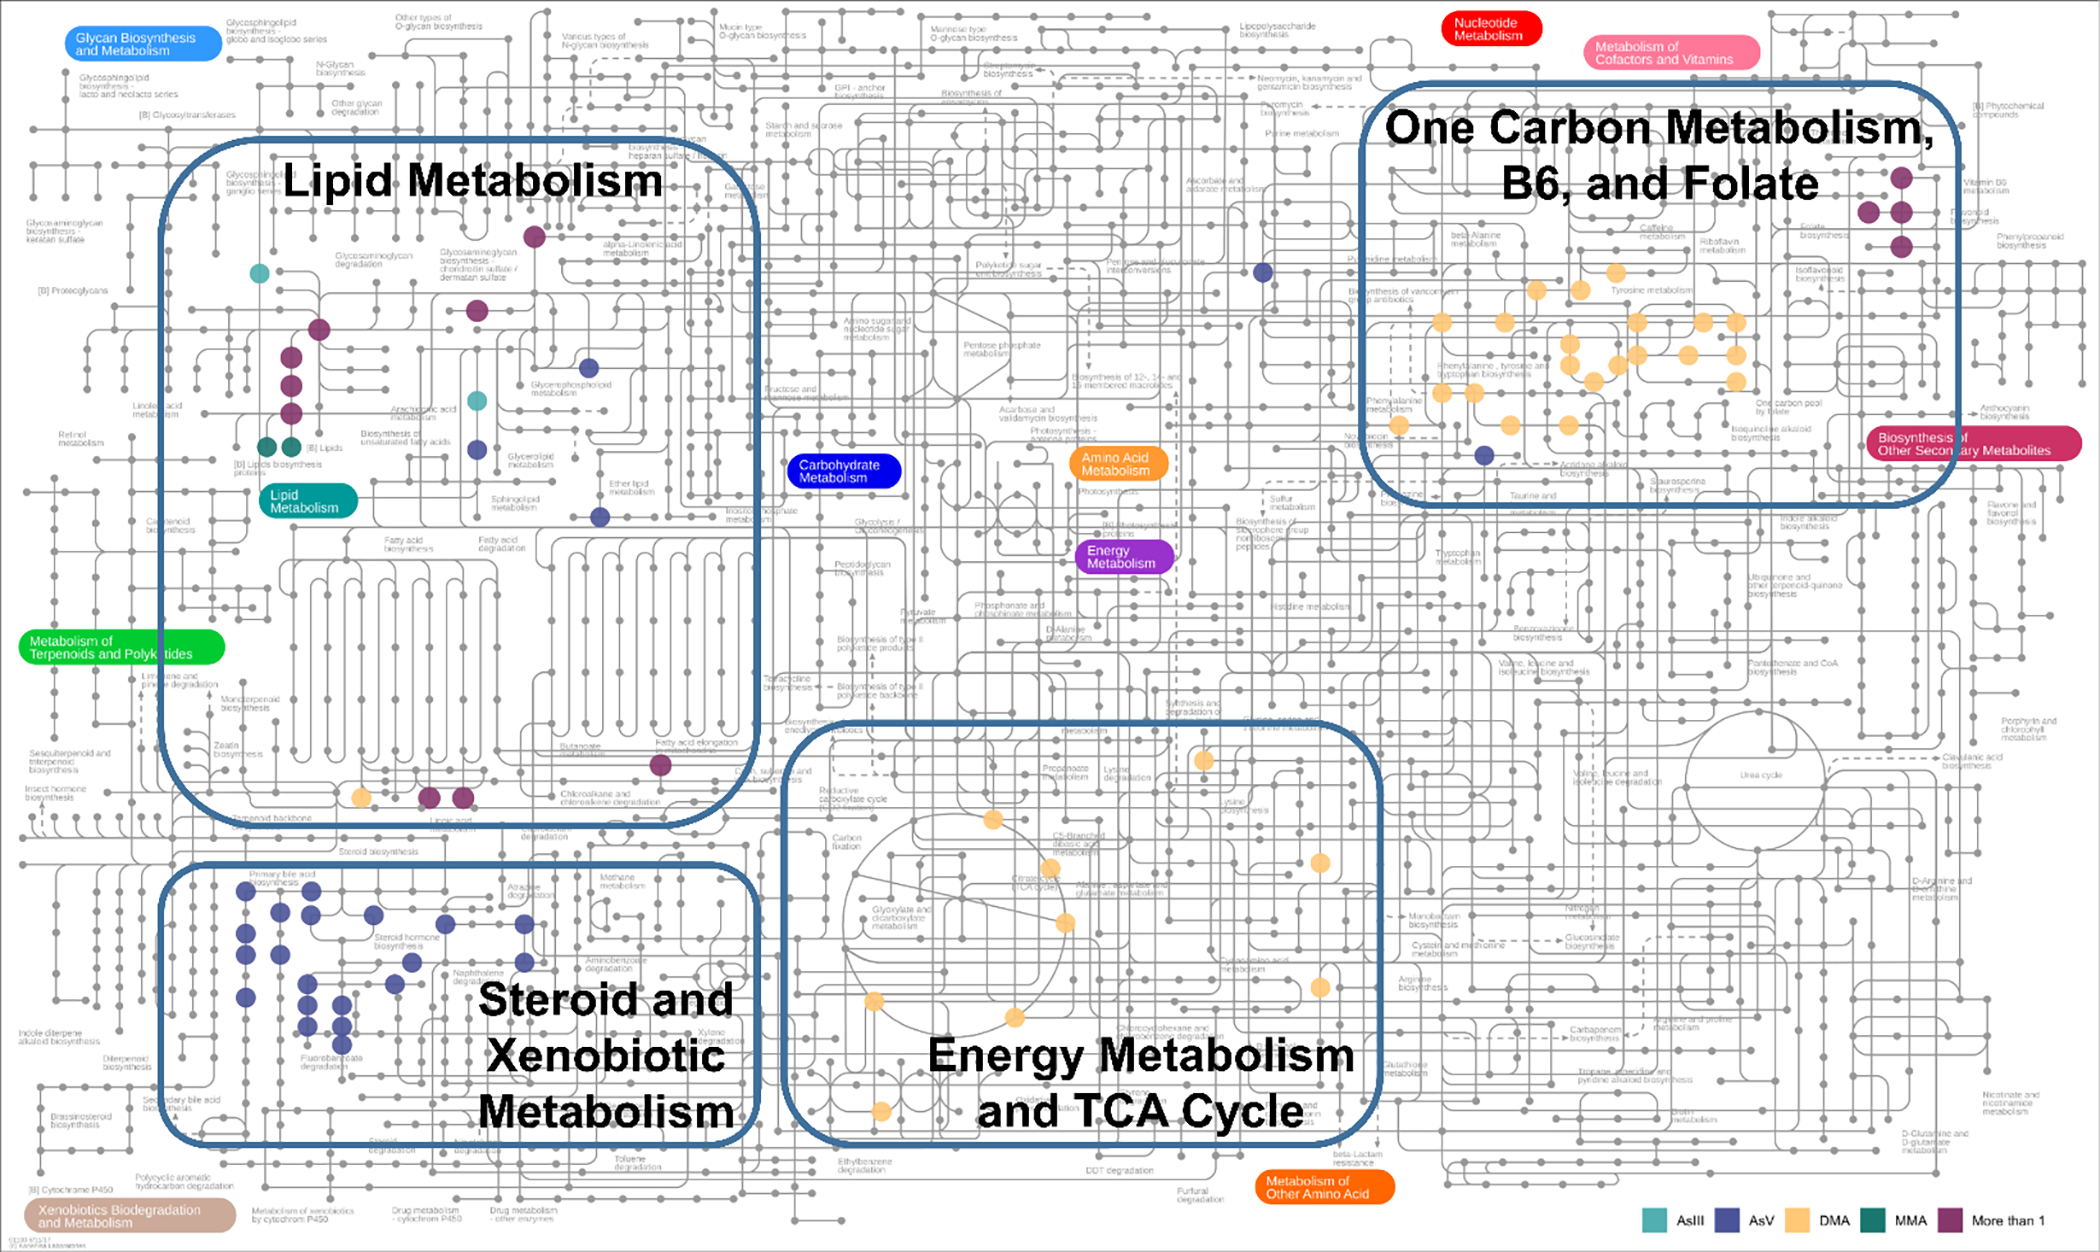
Figure 4.

KEGG human metabolic map showing the clustering of related pathways associated with As exposure around four central themes. Each colored dot represents a metabolite associated with a specific As species. We identified four general metabolic paths, shown in rectangles and group labels. The lipid metabolism pathway was well represented by all As species. AsV was associated with xenobiotic metabolism. DMA was associated with energy metabolism and TCA cycle as well as metabolites related to one carbon metabolism such as vitamin B6 and folate.
