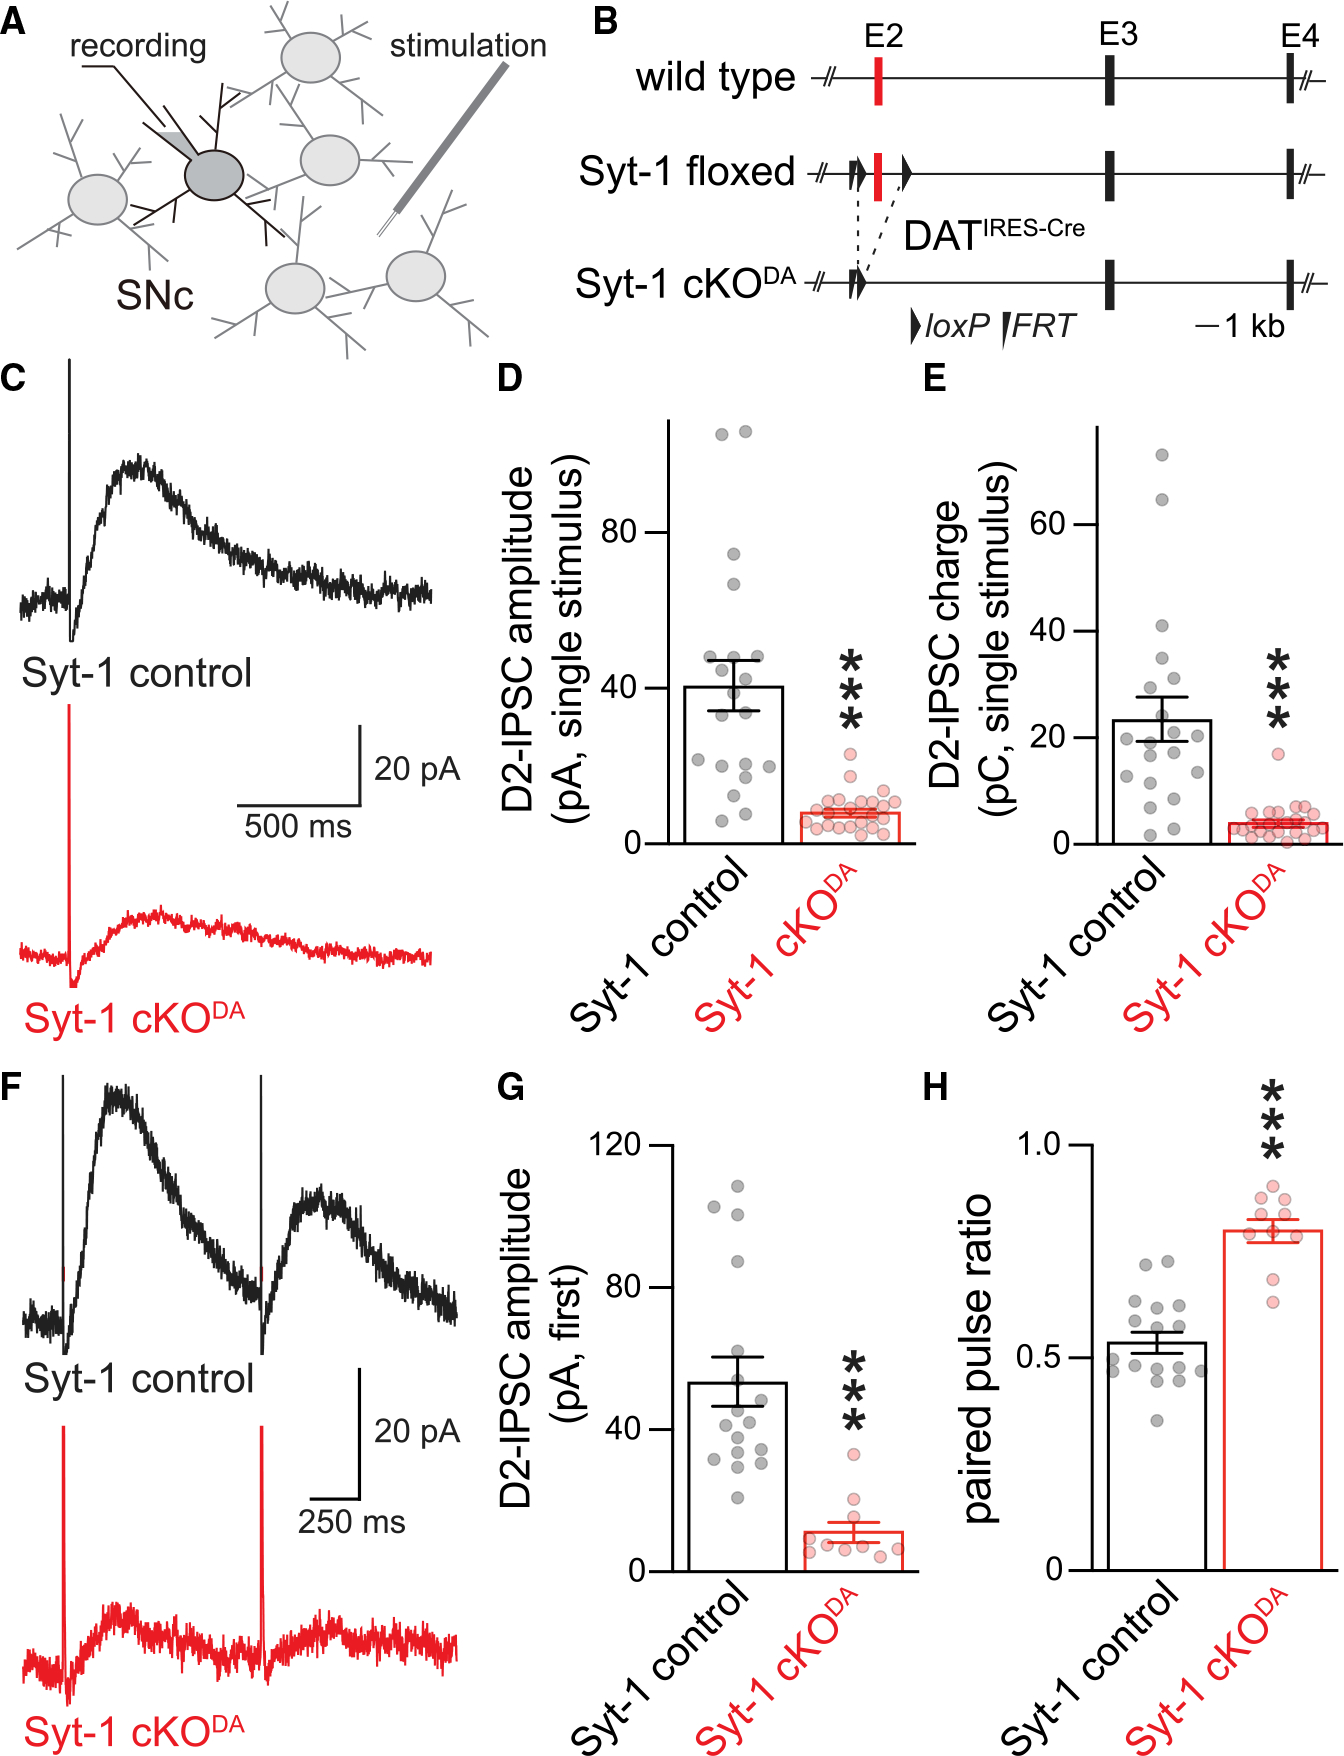
Figure 1. Somatodendritic dopamine release is strongly decreased in Syt-1 cKODA mice.

(A and B) Schematic of recording (A) in the substantia nigra pars compacta (SNc) and of Syt-1 cKODA mice (B) generated as described before.29 Exon numbers refer to coding exons.
(C–E) Example traces (C) and quantification of amplitude (D) and charge (E, area under the curve) of D2-IPSCs evoked by a single stimulus. Syt-1 control 20 cells/6 mice, and Syt-1 cKODA 23 cells/6 mice.
(F–H) Example traces of D2-IPSCs evoked by two electrical stimuli with a 1 s interval (F), and quantification of the first peak amplitude (G) and ratio of the amplitude of the second to the first D2-IPSC (H, paired pulse ratio). Syt-1 control 17 cells/7 mice, and Syt-1 cKODA 10 cells/4 mice. Data are mean ± SEM; ***p < 0.005 as determined by Mann Whitney rank-sum tests (D, E, and G) or an unpaired Student’s t test (H). For basal electrical properties, see Figure S1; for D2-IPSC rise times, see Figure S2.
