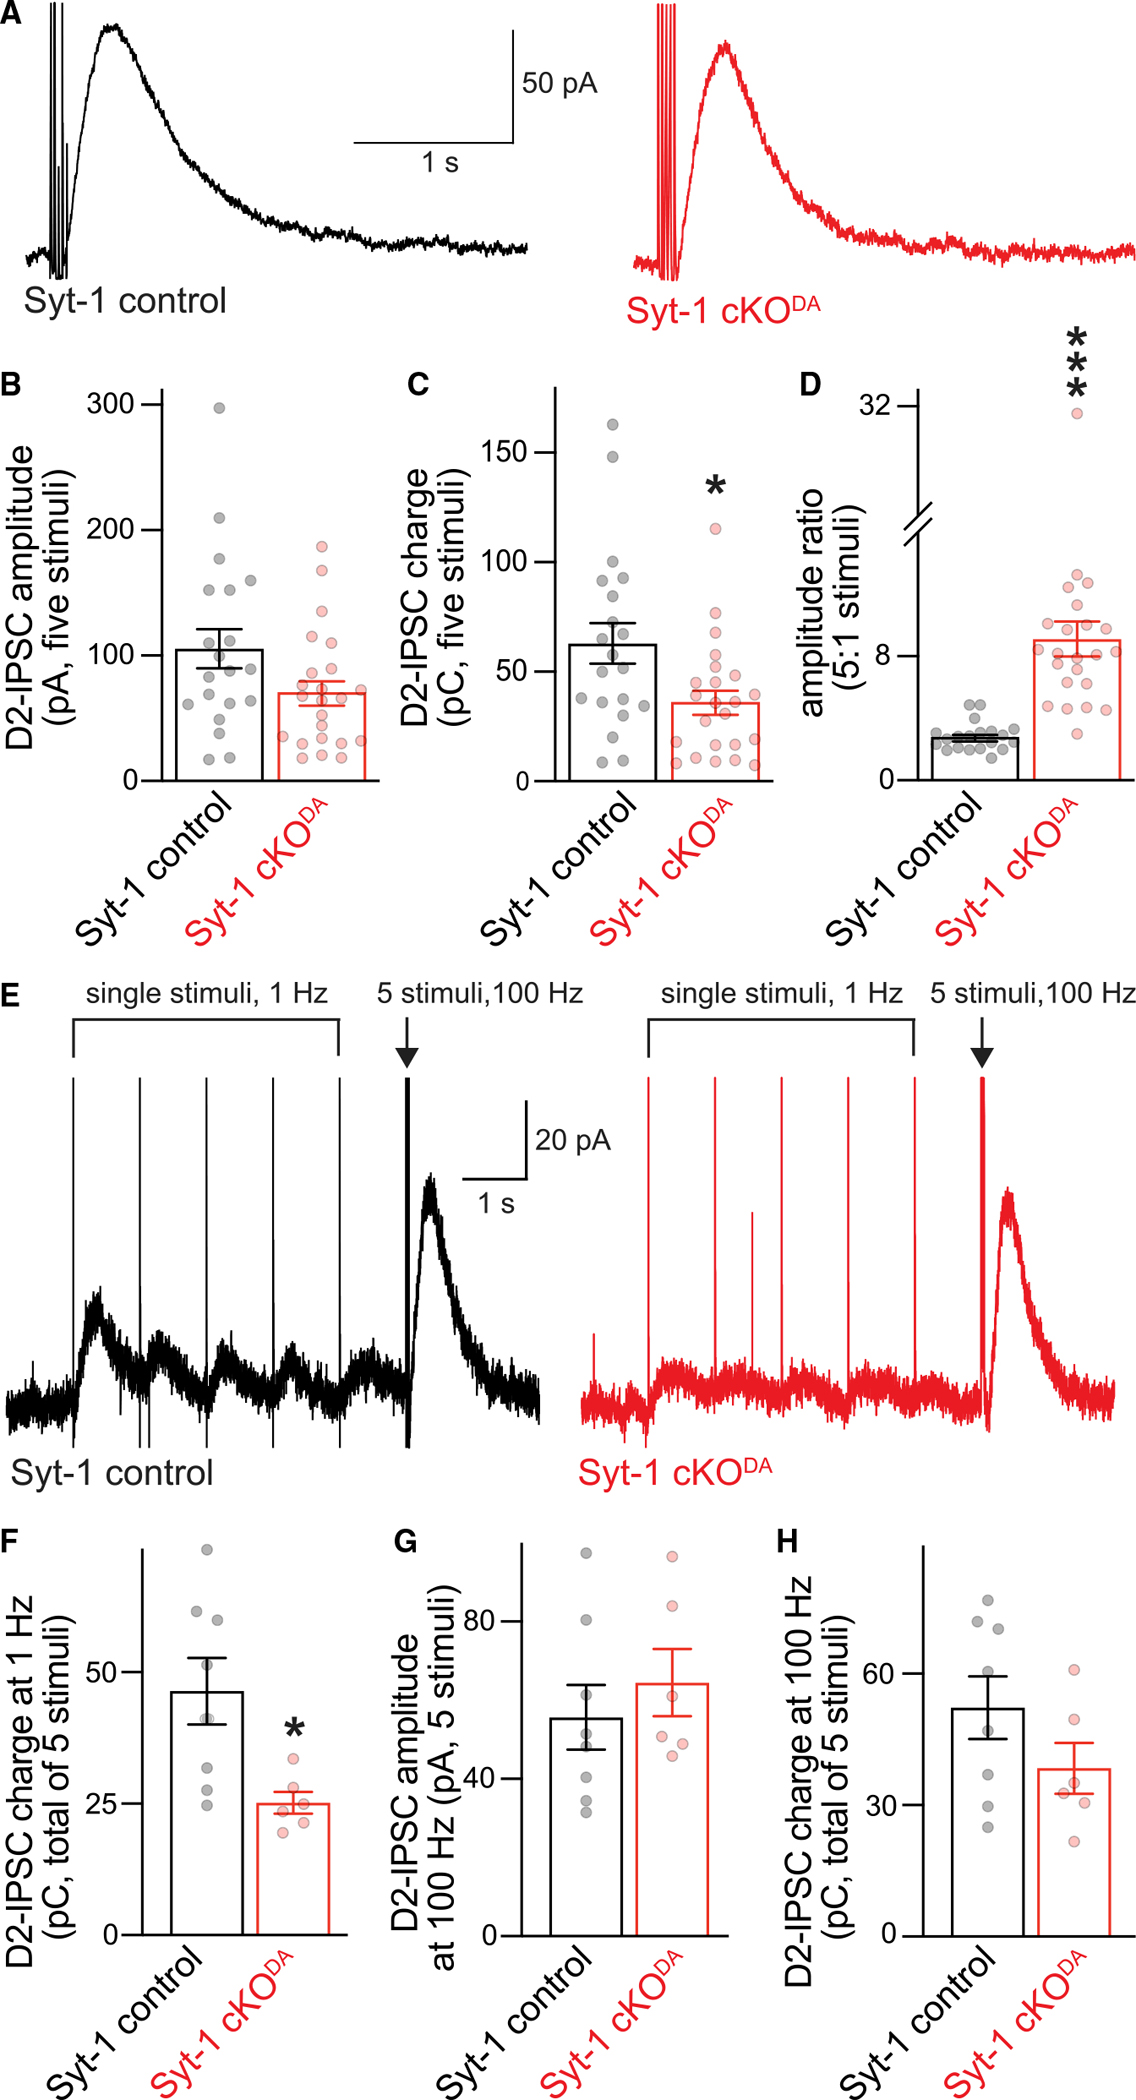
Figure 3. Somatodendritic dopamine release in response to stimulus trains.

(A–D) Example traces (A) and quantification of amplitude (B) and charge (C, area under the curve) of D2-IPSCs evoked with a train of five electrical stimuli at 40 Hz, and ratio of the 5- to 1-stimulus D2-IPSC (D, single-stimulus amplitudes are from Figure 1C and were recorded in the same cells). Syt-1 control 20 cells/6 mice, and Syt-1 cKODA 23 cells/6 mice.
(E–H) Example traces of D2-IPSCs evoked by 5 stimuli at 1 Hz followed by a 5-stimulus train at 100 Hz (E), and quantification of the summed 5-stimulus D2-IPSC charge at 1 Hz (F), and the 5-stimulus amplitude (G) and charge (H) at 100 Hz. Syt-1 control 8 cells/3 mice, and Syt-1 cKODA 6 cells/2 mice.
Data are mean ± SEM; *p < 0.05, ***p < 0.005 as determined by Mann Whitney rank-sum tests (B–D) or unpaired Student’s t tests (F–H).
