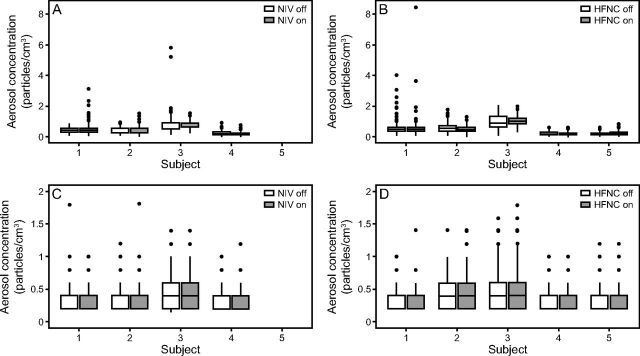
Fig. 1.
Box-and-whisker plots of aerosol concentrations measured by the Optical Particle Sizer 3330 (A and B) and Wideband Integrated Bioaerosol Sensor (C and D) for each participant with the high-flow nasal cannula (HFNC) (B and D) and noninvasive ventilation (NIV) (A and C) off versus on. Participant #5 was not able to complete the NIV measurements due to time constraints, which is why that data point is missing. Note that these distributions do not include measurements during the warm-up period for the HFNC. The center line of each box indicates the median, the edges of the boxes indicate the 25th and 75th percentiles, and whiskers indicate the largest or smallest values within 1.5 times the interquartile range from quartiles 3 and 1, respectively.

