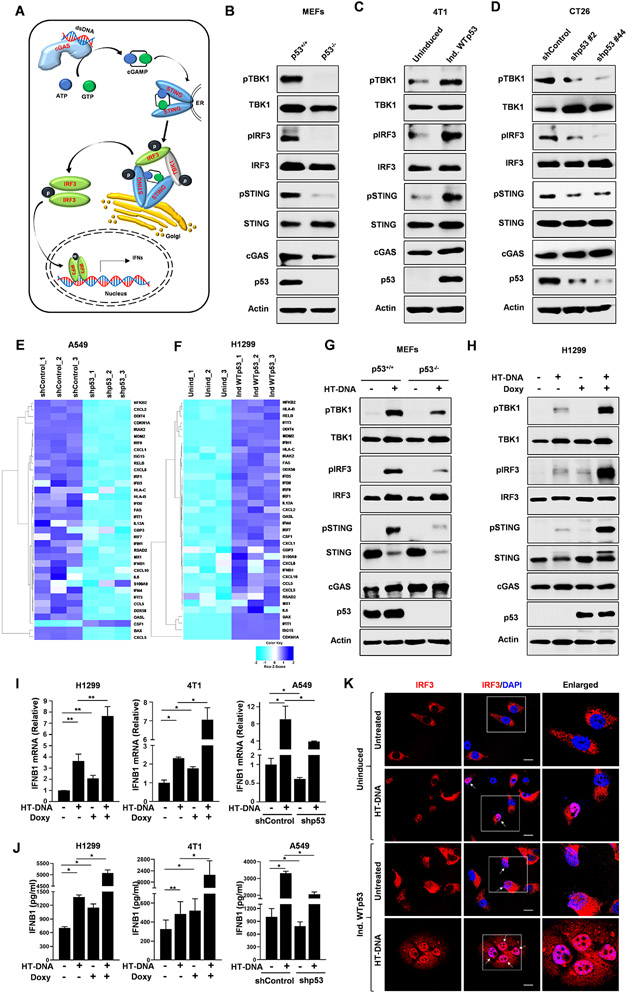
Figure 1: WTp53 activates the cGAS/STING innate immune pathway.
(A) Schematic diagram shows cytosolic DNA sensing pathway and the phosphorylation events of TBK1, STING and IRF3. Western blot analysis of (B) p53+/+ and p53 −/− mouse embryonic fibroblast (MEFs). (C) P53 null mouse 4T1 cells engineered to inducibly express WTp53. (D) P53 was knocked down using two different shRNAs in CT26 cells and cell lysates were analyzed by western blot. (E-F) Heat maps show the differential gene expression as accessed by Nanostring (n=3) in (E) A549 shControl and shp53 and (F) H1299 Uninduced or induced WTp53. (G) p53+/+ and p53−/− MEFs were treated with 2 μg/ml of HT-DNA for 3 h and harvested for western blot analysis. (H) P53 null H1299 cells were engineered to inducibly express WT53. Cells were treated for 24 h with Doxycycline to induce p53 and then treated with 2 μg/ml of HT-DNA for 3 h and subjected to western blot analysis. (I and J) P53 null H1299 and 4T1 cells were induced to express WTp53, and A549 shControl or shp53 cells were treated with 2 μg/ml HT-DNA for 18 h, and cells were harvested for RT-PCR analysis of IFNB1 mRNA (I) or the conditioned medium was harvested for ELISA detection of secreted IFNB1 (J). (K) Representative CLSM images of IRF3 in H1299 cells induced to express WTp53 and treated with HT-DNA for 3 h. Scale bar=10 μm.
Quantification graphs: In all panels, error bars represent mean with standard deviation. p values are based on Student’s t test. ***p < 0.001, **p < 0.01, *p < 0.05, ns=non-significant. See also Figure S1.

