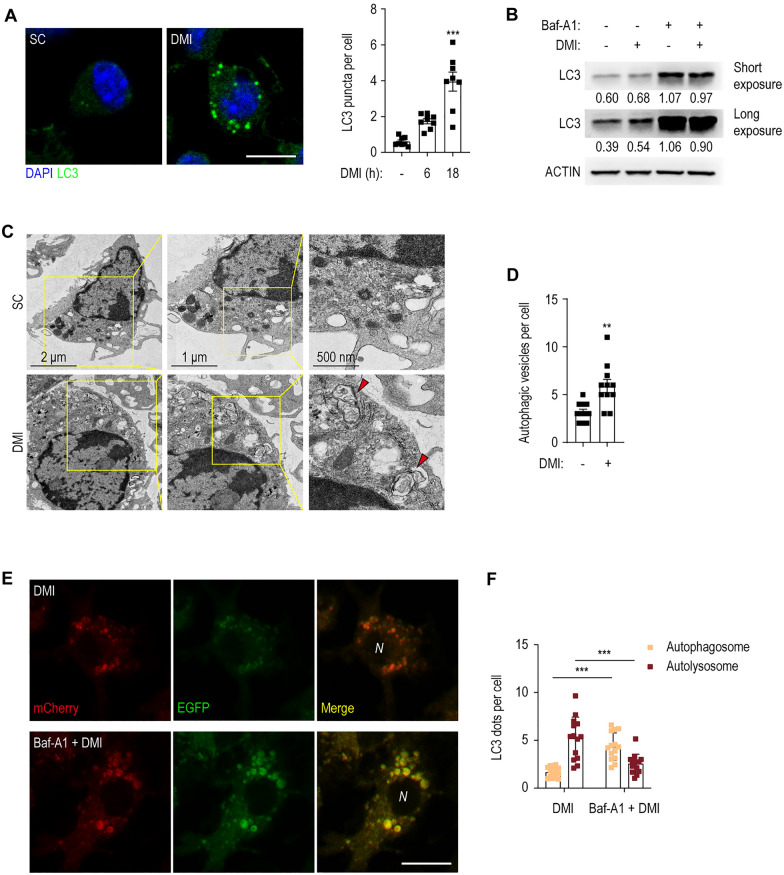
Fig. 4.
DMI-treatment increases the activation of autophagy and autophagic flux. A BMDMs were treated with SC or DMI (100 μM) for the indicated times and stained with anti-LC3 (green) and DAPI (for nuclei; blue). Representative immunofluorescence microscopy images (left panel) and quantitation of LC3 puncta per cell (right panel). At least 100 cells in independent 8 fields were counted in each group from two different experiments. Scale bar, 2 μm. B BMDMs were pre-incubated with or without Baf-A1 (100 nM) for 2 h and followed by treatment with SC or DMI (100 μM) for 8 h. LC3 and ACTIN levels were evaluated by Western blot analysis. C, D BMDMs were treated with SC or DMI (100 μM) for 18 h. Representative TEM image (C) and quantitation of autophagic vesicles per cell (D). E, F BMDMs were transduced with retroviruses expressing a tandem-tagged mCherry-EGFP-LC3B. After 24 h, cells were pre-incubated with or without Baf-A1 (100 nM) for 2 h and followed by treatment with SC or DMI (100 μM) for 24 h. Cells were collected and mCherry or EGFP expressing LC3B were detected by confocal microscopy. Representative immunofluorescence microscopy images (E) and quantitation of LC3 dots per cell (F). Scale bars, 2 μm. Statistical analysis was determined with one-way ANOVA test with Tukey’s multiple comparisons (A), unpaired Student’s t-test (D), and two-way ANOVA test with Sidak’s multiple comparisons (F). Data are representative of at least three independent experiments, and error bars denote ± SD. SC solvent control, DMI dimethyl itaconate, Baf-A1 bafilomycin A1, N nucleus. **p < 0.01 and ***p < 0.001

