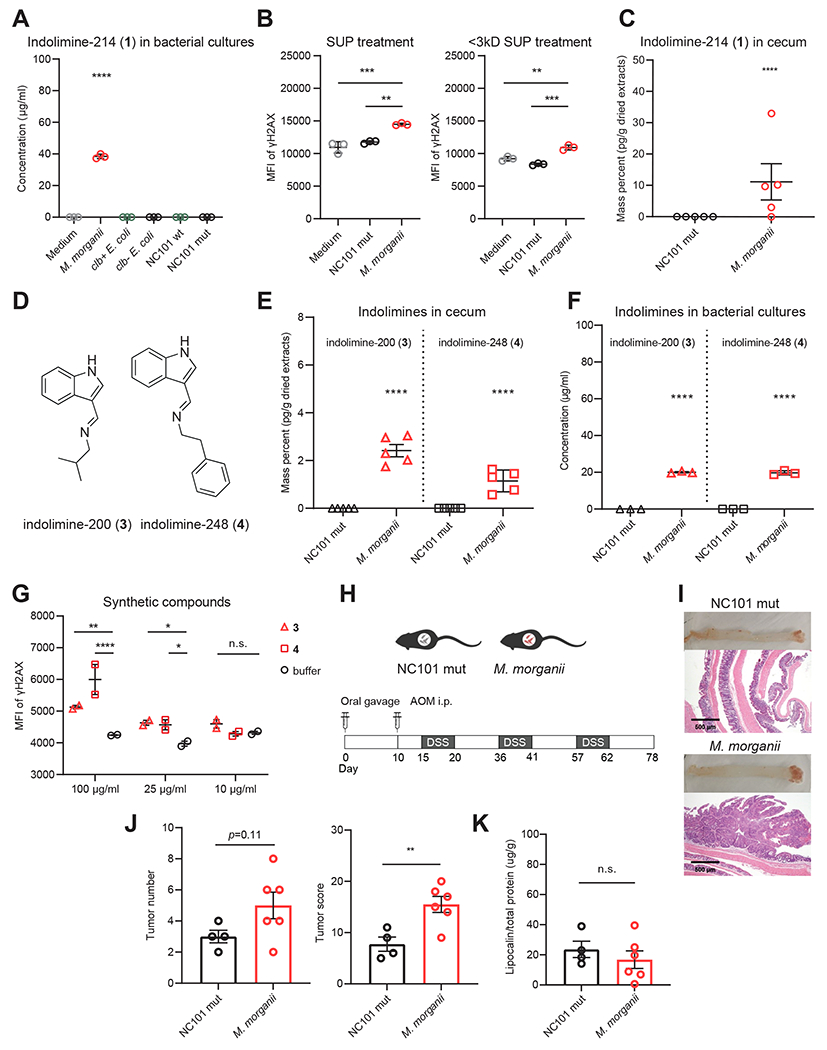
Figure 4. M. morganii produces multiple genotoxic indolimines in vivo and exacerbates CRC in gnotobiotic mice.

(A) UPLC-QTOF-MS quantification of indolimine-214 (1) in medium or bacterial supernatants of M. morganii, clb+ E. coli, clb− E. coli, NC101 wt E. coli or NC101 mut E. coli. **** p<0.0001, one-way ANOVA.
(B) MFI of γ-H2AX in HeLa cells treated with 40 % (v/v) SUP or <3 kDa SUP from medium, M. morganii, or NC101 mut E. coli for 5-6 h. ** p<0.01; *** p<0.001, one-way ANOVA.
(C) QTOF-MS quantification of indolimine-214 (1) in cecal contents of gnotobiotic mice colonized by M. morganii, or NC101 mut E. coli. **** p<0.0001, Student’s t-test.
(D) Chemical structures of compounds indolimine-200 (3) and indolimine-248 (4).
(E) QTOF-MS quantification of indolimine-200 (3) and indolimine-248 (4) in cecal contents of gnotobiotic mice colonized by M. morganii, or NC101 mut E. coli. **** p<0.0001, Student’s t-test.
(F) UPLC-QTOF-MS quantification of indolimine-200 (3) and indolimine-248 (4) in bacterial supernatants of M. morganii or NC101 mut E. coli. **** p<0.0001, Student’s t-test.
(G) MFI of γ-H2AX staining for HeLa cells treated with synthetic compounds at indicated concentrations for 5 h. n.s., not significant; * p<0.05; ** p<0.01; **** p<0.0001, two-way ANOVA.
(H) Schematic of experimental design for CRC induction in age-matched gnotobiotic mice colonized with M. morganii or NC101 mut E. coli.
(I-K) Representative colon tissue and histology images (I), tumor number and tumor score (J), and fecal lipocalin 2 levels (K; Day 78) in gnotobiotic mice colonized with M. morganii or NC101 mut E. coli. Each dot represents one mouse (n = 4-6 per group), n.s., not significant; ** p<0.01, Student’s t-test.
