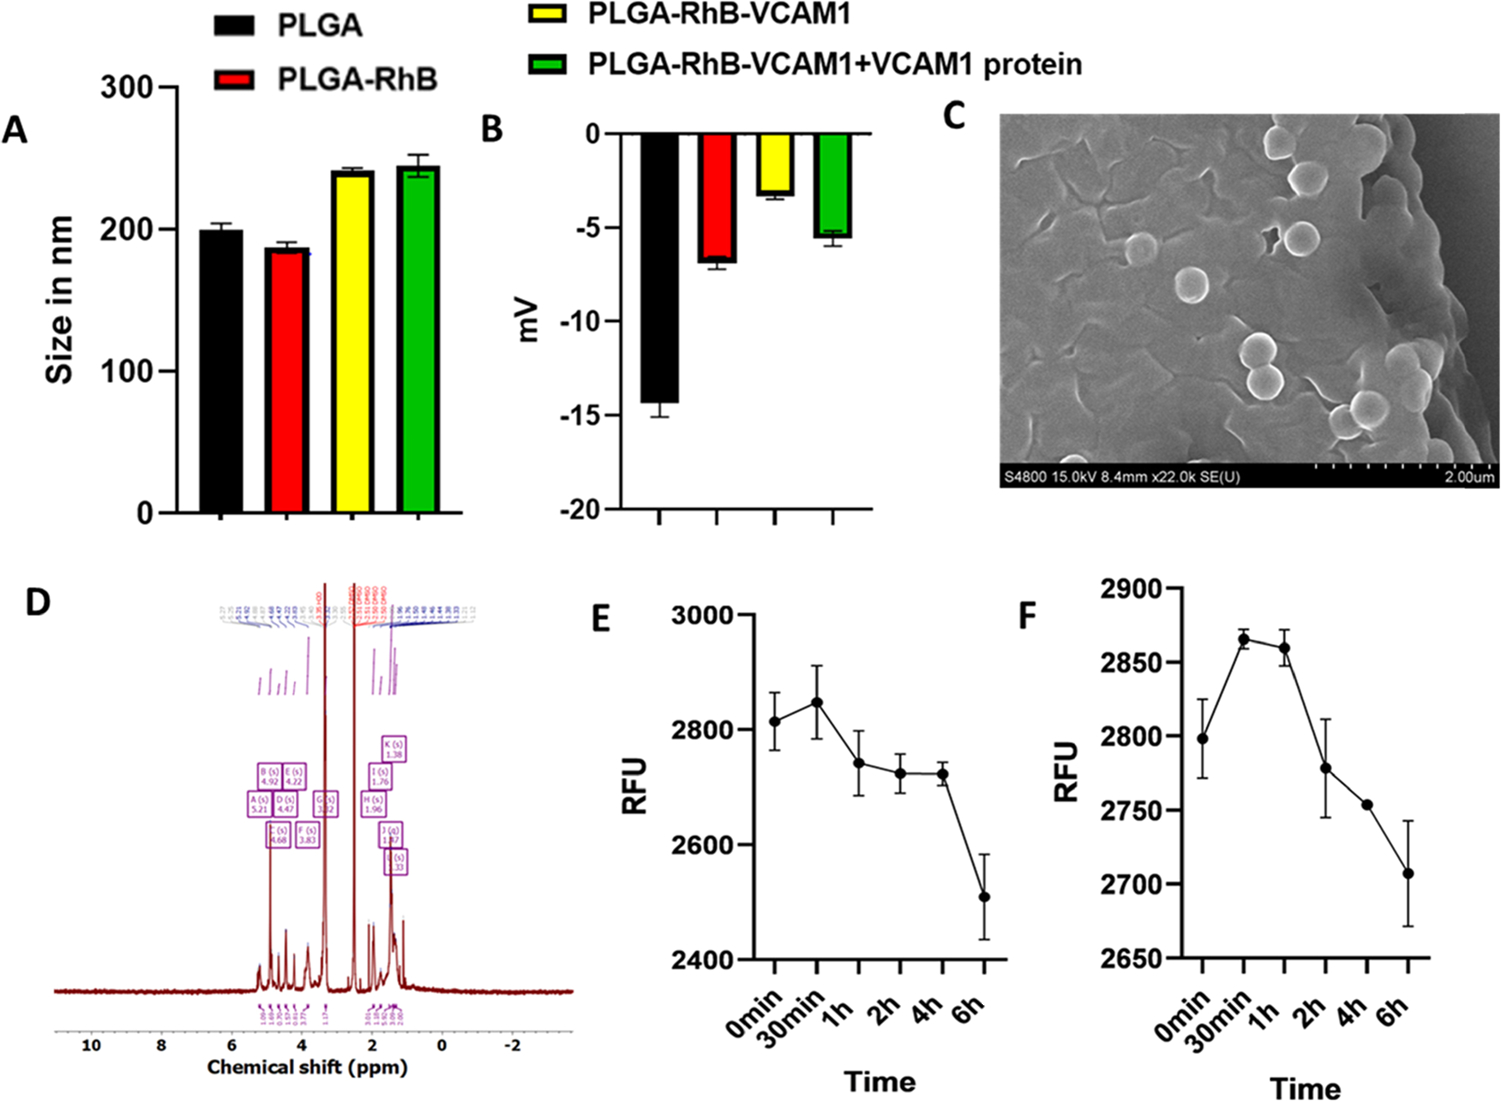
Figure 2.

Characterization of the nanoprobe. Particle size (A), zeta potential (B), stability in PBS(C), and stability in FBS (10%) (D). Particle size and zeta potential of the PLGA–RhB–VCAM1 nanoparticle were 241.43 nm and −3.33 mV, respectively, whereas the PLGA nanoparticle measured only 200.1333 nm for size and −14.3 mV for zeta potential (A, B). Change in the zeta potential of PLGA–RhB–VCAM1 + VCAM1 protein indicates the conjugation of the protein with the peptide present in the particle. SEM image (C) and NMR (D) of the PLGA–VCAM1–RhB nanoparticle. Stability of the nanoprobe (PLGA–RhB–VCAM1) was measured in PBS and 10% FBS up to 6 h (E, F). The fluorescence intensity was expressed in RFU (relative fluorescence unit). In both solutions, the fluorescence intensity was observed to decrease with time. After 6 h of incubation, the intensity of the particles was decreased in PBS by 2.99 in PBS and 3.25% in 10% FBS.
