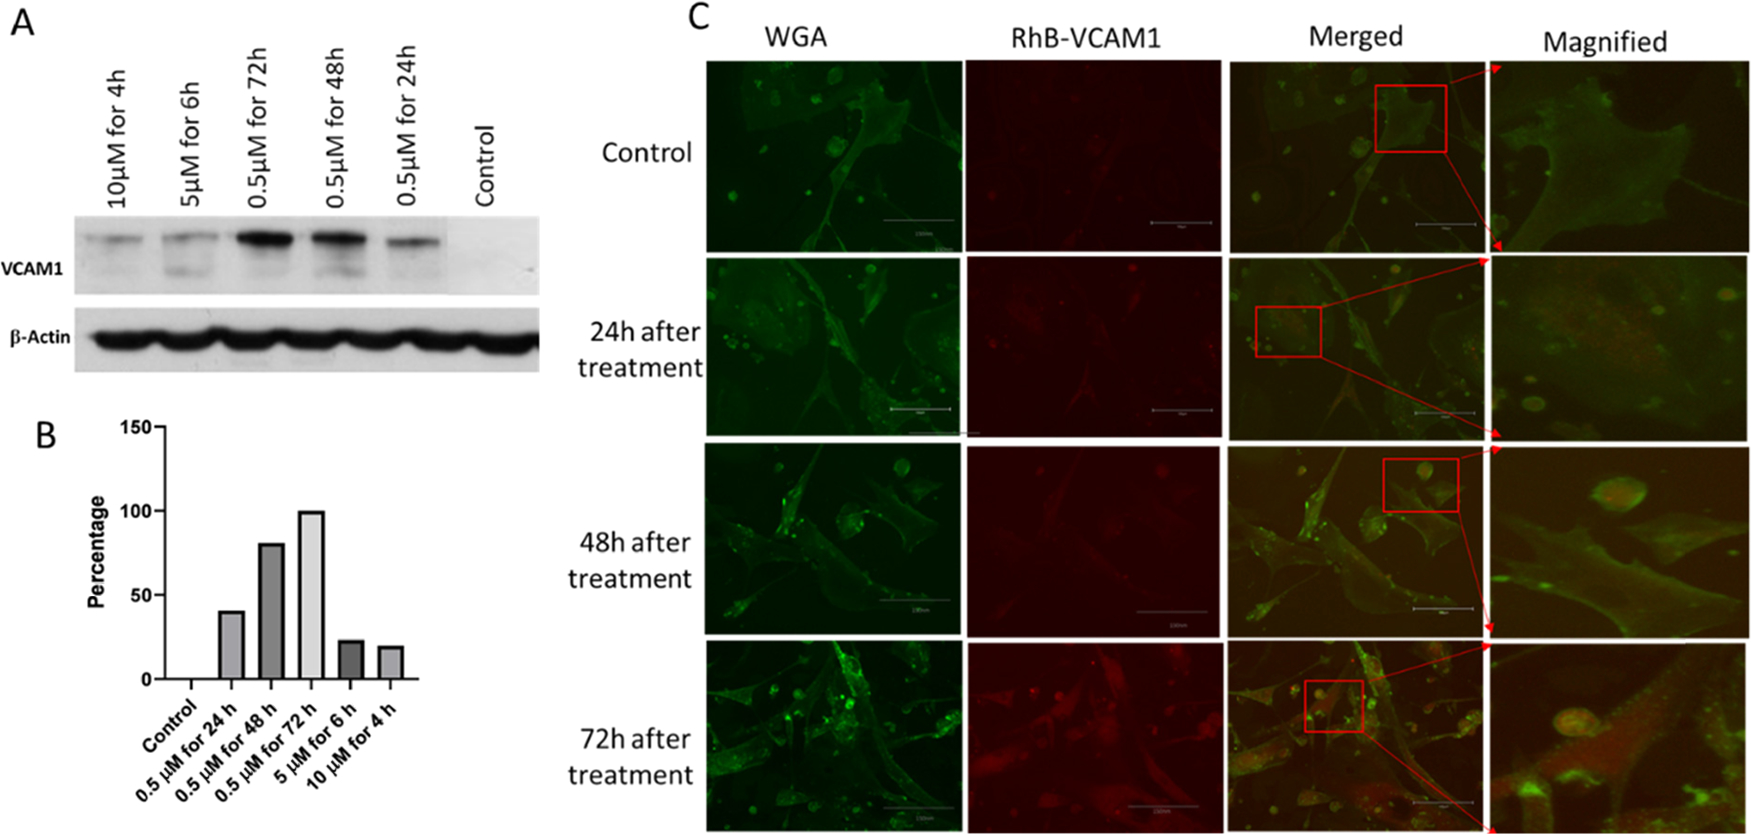
Figure 5.

(A) Western blot analysis of VCAM1 protein in the different treatment groups (10 μM for 4 h, 5 μM for 6 h, and 0.5 μM for 72, 48, and 24 h). Proteins collected from untreated HCM cells were considered as a control. 5 μM of DOX treatment at different time points shows more expression of VCAM1 protein than acute insult with 10 and 5 μM. VCAM1 protein expression was the highest for 72 h of DOX treatment. (B) Graph representing the quantification of the WB data in percentage. (C) Microscopic image of HCM shows the cellular uptake of VCAM1–RhB in the injured cells. Control refers to healthy cells without DOX treatment. Cells were treated with 0.5 μM of DOX for 24, 48, and 72 h. Scale bar represents 300 μm.
