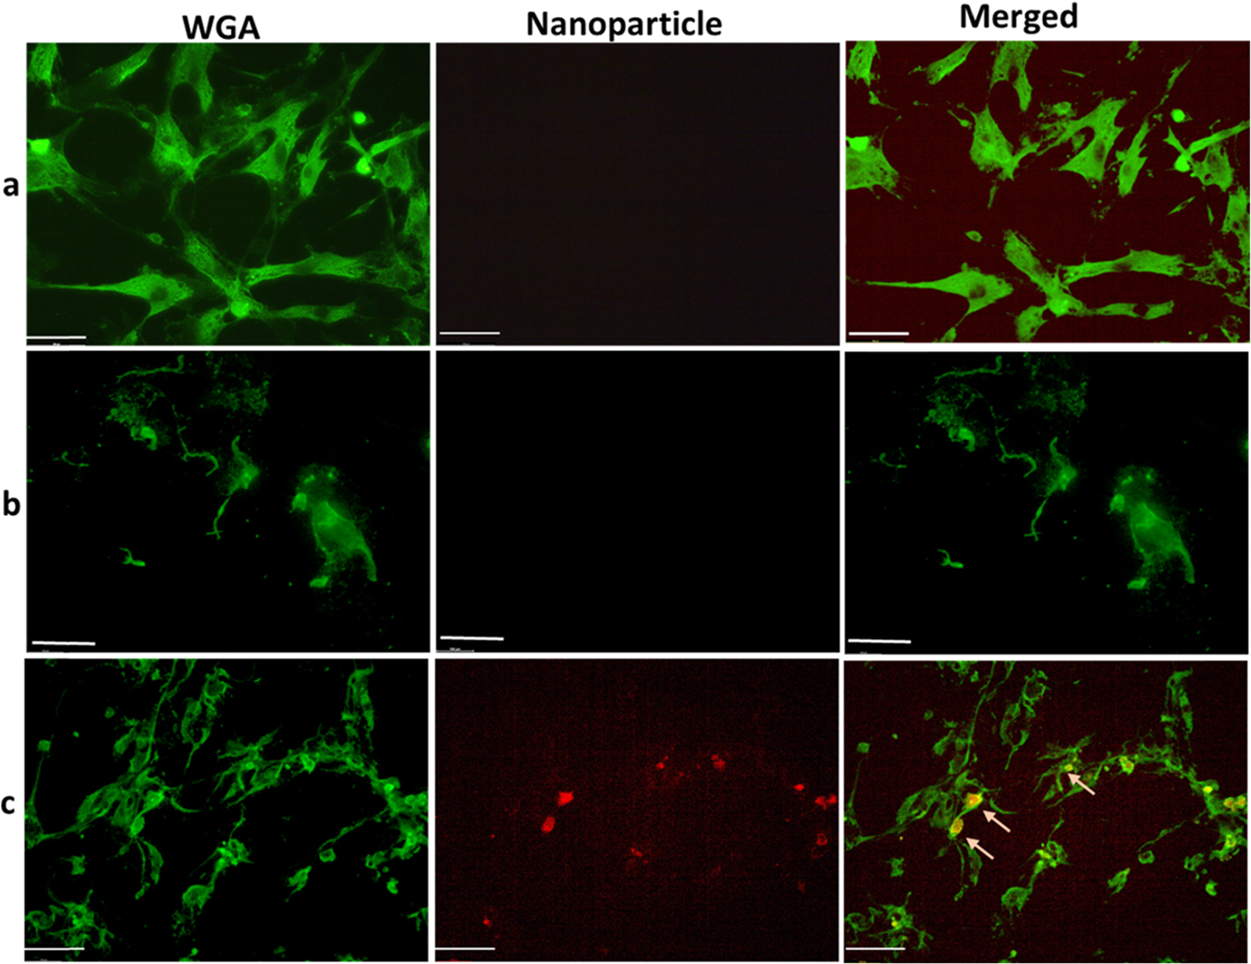
Figure 6.

Microscopic image showing the uptake of nanoparticles in HCM. Cells were treated with 0.5 μM of DOX for 72 h to create chronic inflammation. Then, the inflamed cells were treated with PLGA–RhB (b) and PLGA–RhB–VCAM1 (c). Healthy cells were also treated with PLGA–RhB–VCAM1. Both the healthy cells and damaged cells treated with nontargeting nanoparticles show any signal of RhB (arrow in row (a, b)), whereas the imaging nanoprobe (PLGA–RhB–VCAM1) shows specific binding and internalization into the cells or cell surface (arrow in row (c)). Scale bar represents 100 μm.
