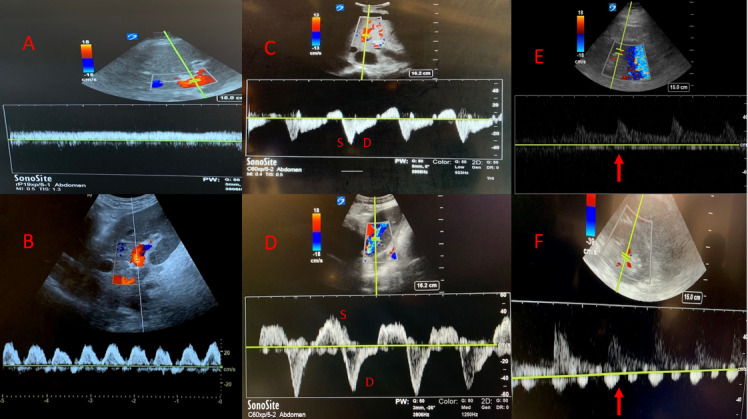
Figure 6 . A) Portal vein doppler showing a continuous flow pattern consistent with a normal RAP, B) Portal vein doppler showing biphasic flow consistent with elevated RAP, C) Hepatic vein Doppler showing anterograde S and D wave consistent with a normal RAP, D) Hepatic vein Doppler showing reversal of flow with retrograde S wave consistent with an elevated RAP, E) Renal vein Doppler showing continuous flow consistent with a normal RAP, F) Renal vein Doppler showing discontinuous flow consistent with an elevated RAP.

