
Figure 2. Minimum output, maximum output, and dynamic range of PTet, PLacUV5, and PAR biosensors at different growth rates.
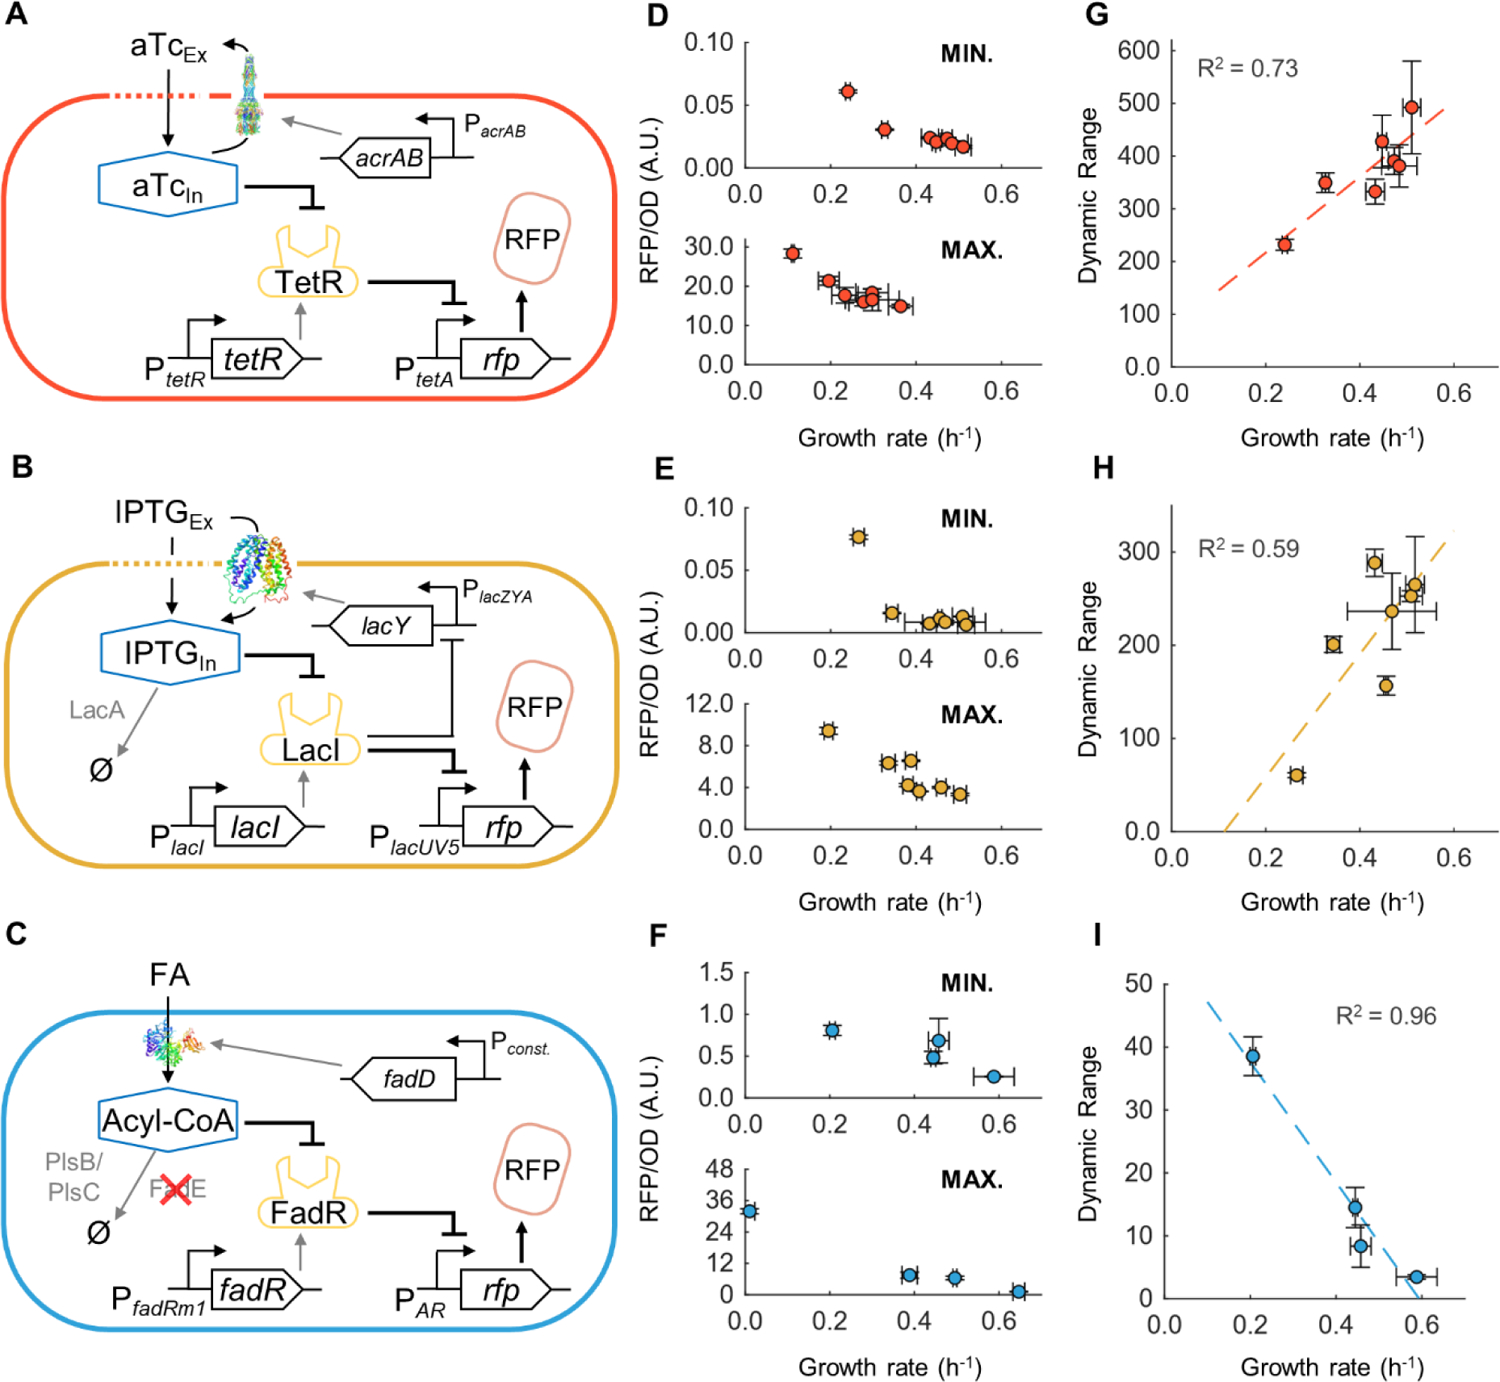
(A-C) Schematic of cellular interactions for the (A) TetR-based biosensor, (B) LacI-based biosensor and (C) FadR-based biosensor. (D-F) Minimum (top) and maximum (bottom) output of the biosensor at different growth rates for (D) TetR, (E) LacI, and (F) FadR-based biosensors. (G-I) Calculated dynamic range of biosensor at different growth rates for (G) TetR, (H) LacI, and (I) FadR-based biosensors. Error bars are S.D. of biological replicates, n=3. Dashed line: Line of best fit.