
Figure 4. The growth rate dependence of DR for TetR-based biosensors with varying TetR production rates.
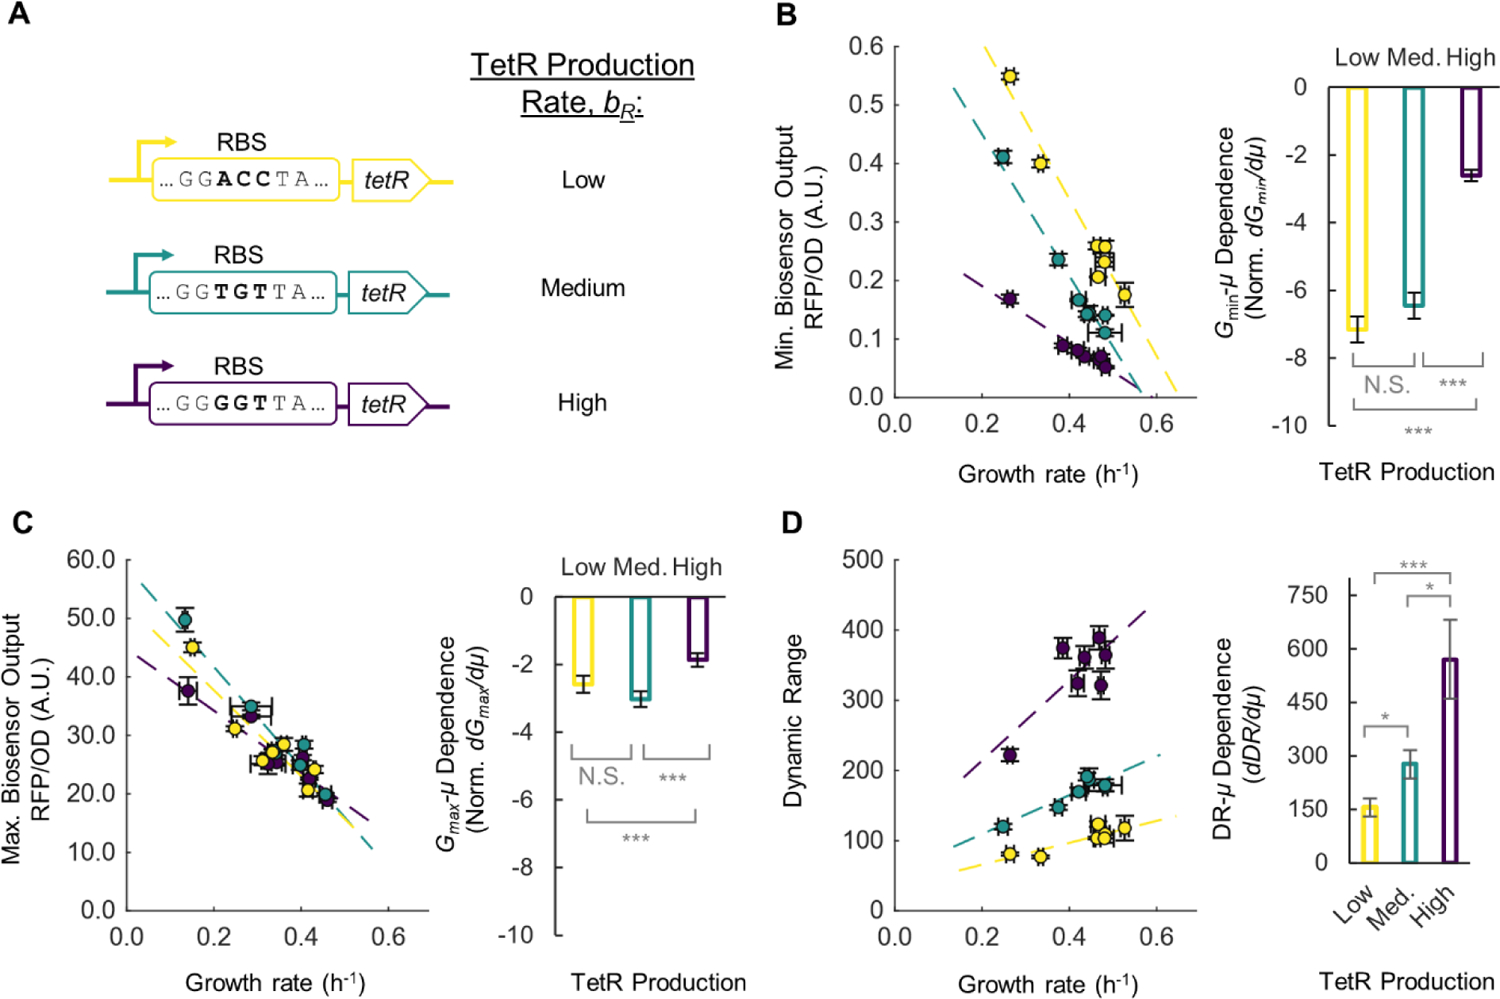
(A) Three tetR genes with different RBS strength to produce TetR at low (yellow), medium (green), and high (purple) levels. (B) Minimum biosensor output at varying growth rate for each library member (left) and the dependence of minimum output on growth rate (right). (C) Maximum biosensor output at varying growth rate for each library member (left) and the dependence of the maximum output on growth rate (right). (D) DR at varying growth rate for each library member (left) and the dependence of DR on growth rate (right). dGmin/dμ and dGmax/dμ are normalized to the average Gmin and Gmax, respectively, from all data. Error bars of individual data points are S.D., n=3. Error bars for Gmin, Gmax, and DR-μ dependence are standard error of the slope. A Student’s t-test was conducted between each pair of growth rate dependence data, stars indicate significant difference (N.S., not significant; * p < 0.05; ** p < 0.01; *** p < 0.001).