
Figure 5. Modeling the impact of passive and active transport mechanism on DR-growth rate dependence for aTc-type biosensors.
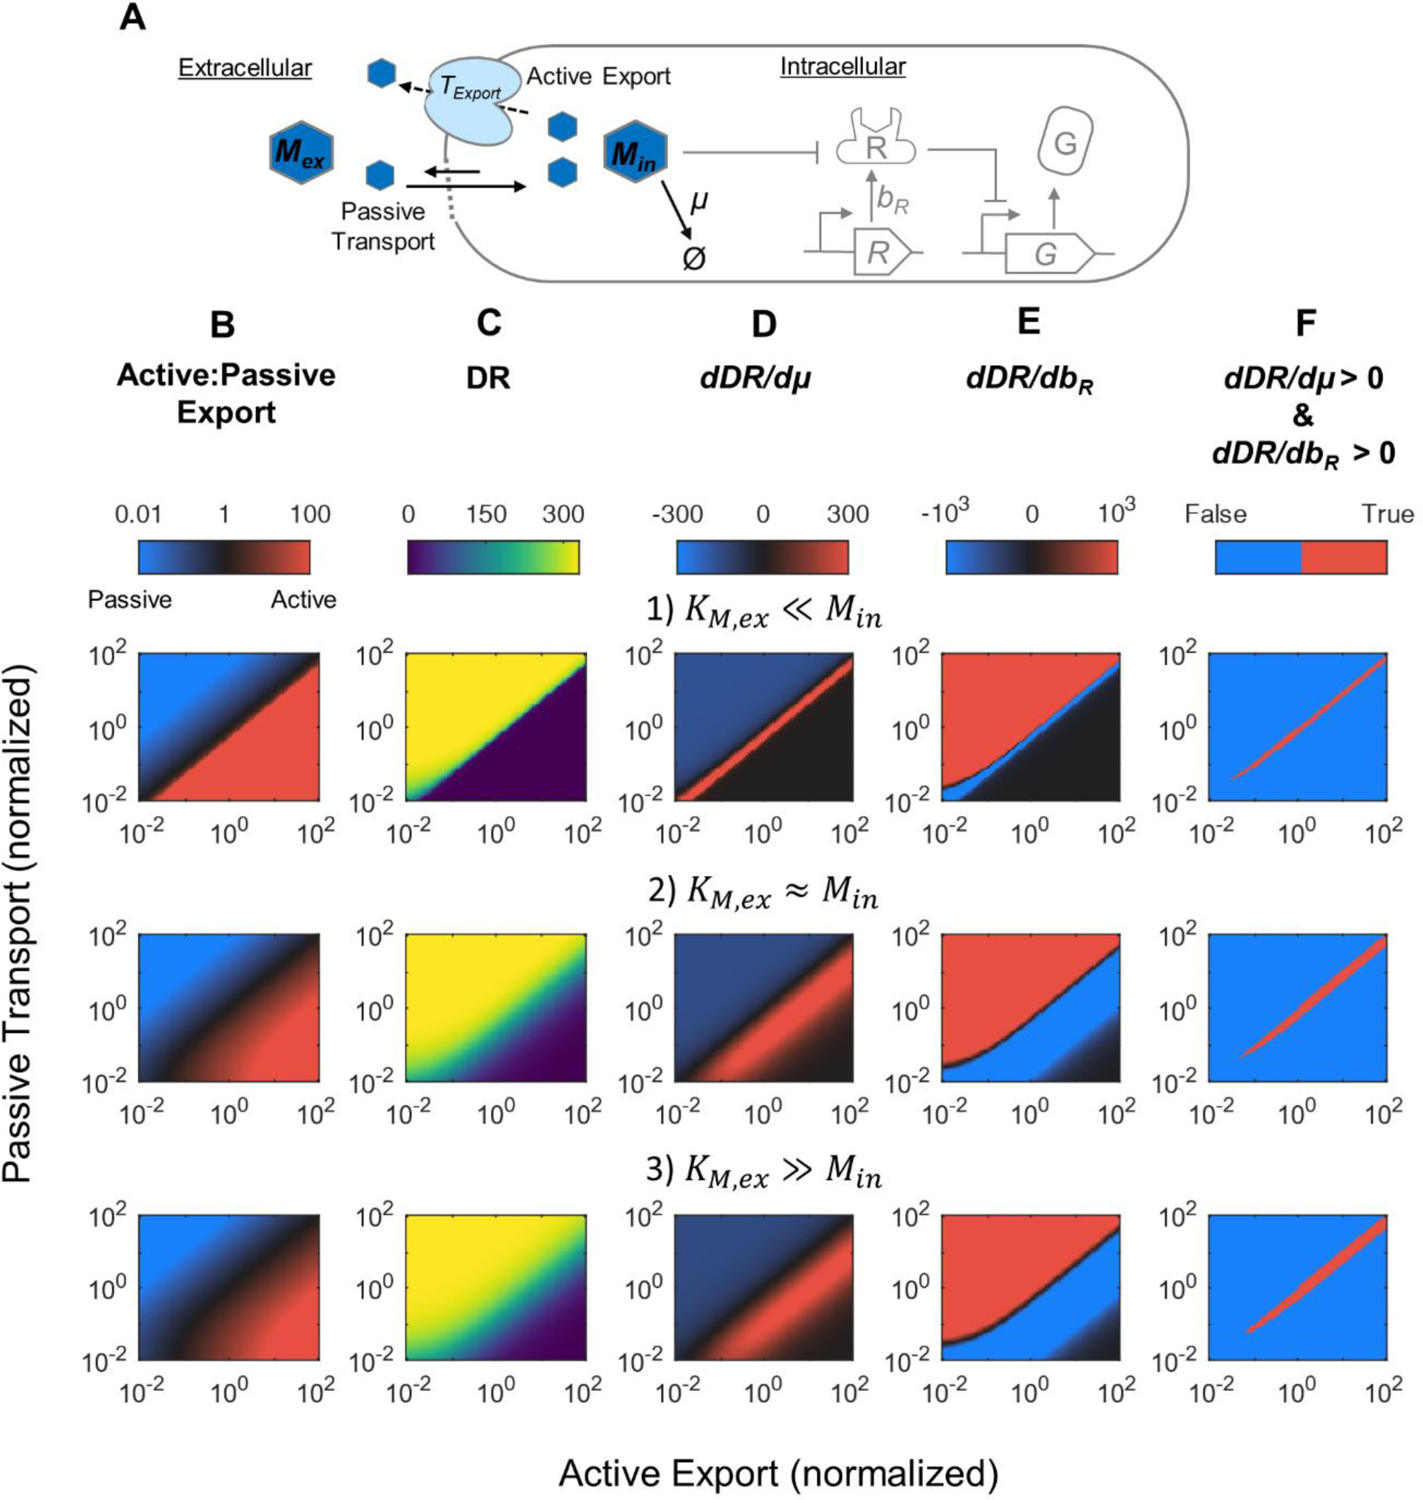
(A) Diagram of transport reactions including passive import of metabolite by diffusion and active export facilitated by a protein transporter. (B) Ratio of active to passive export rates, (C) Calculated DR, (D) dDR/dμ, (E) dDR/dbR, and (F) Parameter region where both dDR/dμ and dDR/dbR are increasing, under different parameter space. The parameters kdiff and kcat,ex were increased to increase passive and active transport rate, respectively. KM,ex was varied to represent three scenarios where its value is either greater, similar, or smaller than the intracellular target metabolite concentration (Min). See Supplemental Fig. S1 and Supplemental Note 2.1 for details. Parameters values are given in Supplemental Table S1.