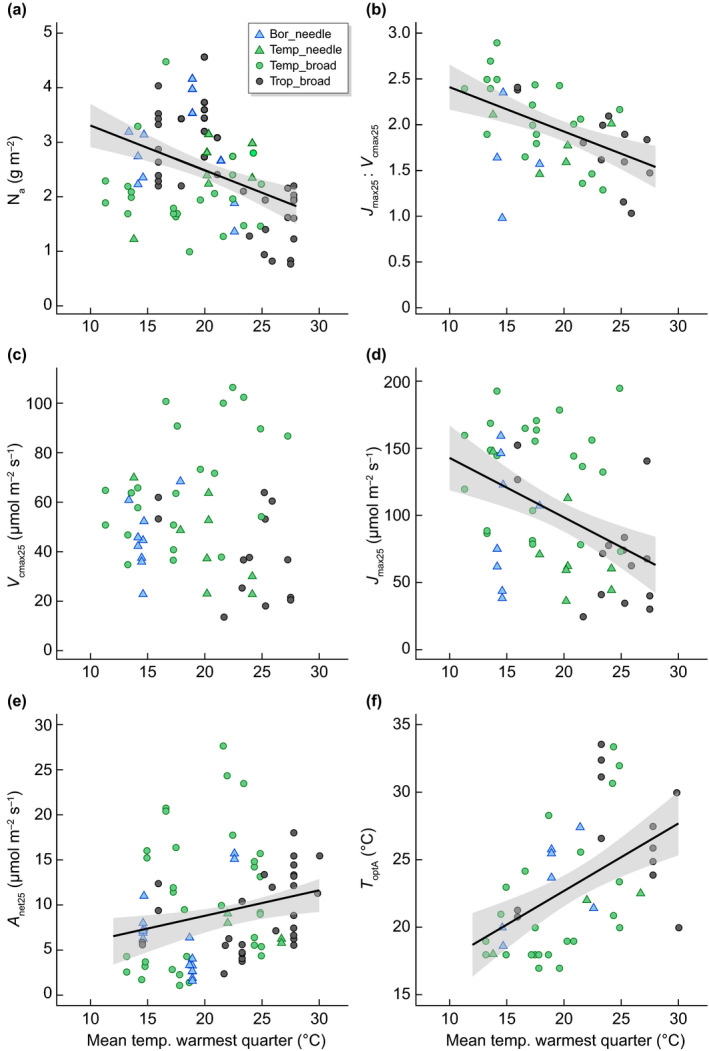
Fig. 1.

Linear regression relationships with 95% confidence intervals (grey area) between several variables against mean temperature of the warmest quarter (or average summer temperatures) to test for latitudinal patterns across biomes (Bor, boreal in skyblue; Temp, temperate in green; Trop, tropical in black) in control conditions based on latitudinal information for (a) nitrogen content (Na = −0.0822x + 4.128, R 2 = 0.16, P < 0.0001), (b) the ratio of maximum carboxylation rate at 25°C (V cmax25) to maximum electron transport rate at 25°C (J max25) (J max25 : V cmax25 = −0.048 + 2.89, R 2 = 0.25, P = 0.0001), (c) maximum carboxylation rate at 25°C (V cmax25), (d) maximum electron transport rates at 25°C (J max25 = −4.43x + 187.09, R 2 = 0.19, P = 0.0002), (e) net photosynthesis measured at a common temperature of 25°C (A net25) (A net25 = 0.28x + 3.15, R 2 = 0.06, P = 0.0088), and (f) the temperature optimum of photosynthesis (T optA) (T optA = 0.499x + 12.698, R 2 = 0.26, P < 0.0001). The partial regressions from the analyses of covariance (ANCOVA) were similar (except for V cmax25) and found in Supporting Information Fig. S2. Different symbols indicate leaf form with triangles for needleleaf and circles for broadleaf species.
