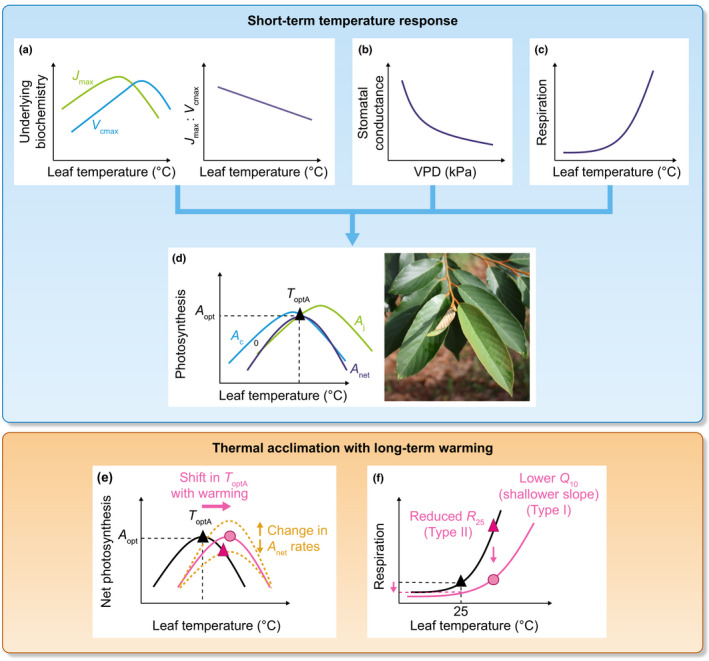
Fig. 2.

The photosynthesis–temperature (T) response is governed by underlying biochemistry (maximum carboxylation rate, V cmax and maximum electron transport rates, J max) (a) and stomatal processes by their responses to vapour pressure deficit (VPD) (b) and leaf respiration during the day (c), each of which has their own temperature response. Together these processes result in a net photosynthesis–temperature curve with a temperature optimum of photosynthesis (T optA black triangle) and a maximum photosynthesis rate at the T opt (A opt) (d), (curve differences emphasised for clarity). While the T opt of J max < T opt of V cmax, Rubisco‐limited photosynthesis (A c) usually declines faster at high temperatures than V cmax, resulting in T opt of A c < T opt of A j (RuBP‐limited photosynthesis). Changes in the temperature response curve of photosynthesis due to thermal acclimation is represented in (e) with a shift in T optA (pink arrow) and/or changes in photosynthesis rates (orange arrows, dotted lines). Changes in the temperature response curve of respiration due to thermal acclimation is represented in (f) with a lower temperature sensitivity (Q 10) and reduced respiration rates at a given temperature (pink arrow). In (e, f), black lines are representing instantaneous temperature responses under current growth temperatures, whereas the pink lines represent the adjustments to long‐term warming for photosynthesis and respiration. The pink triangles represent the short‐term response to warming without thermal acclimation (black and pink triangles, respectively). Pink circles represent the long‐term response to warming. Both lower respiration rates and similar to higher photosynthesis rates at higher temperatures due to acclimation improve the carbon gain balance compared with when these adjustments would not have occurred, compare pink triangles with pink circles in (e, f).
