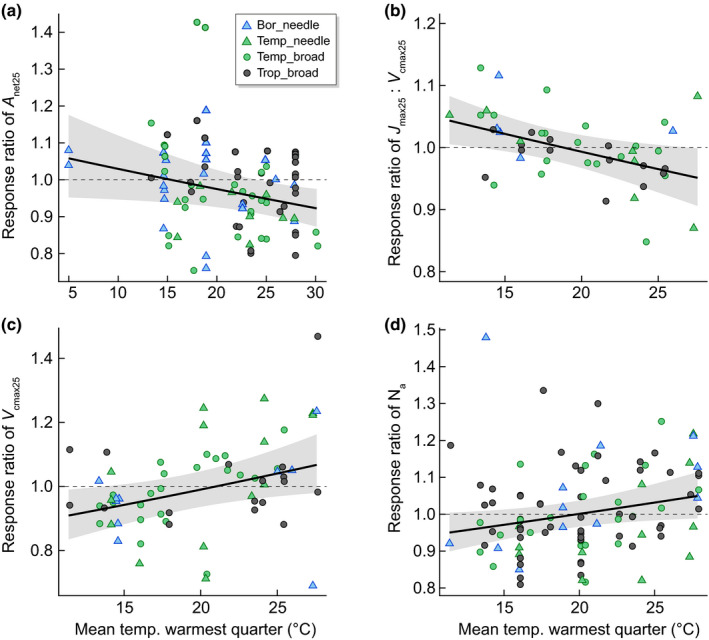
Fig. 5.

Partial residuals with 95% confidence intervals (grey area) of various response ratios (RR) as a function of mean temperature of the warmest quarter from the visreg R package to represent the effect of biome for (a) net photosynthesis at 25°C (A net25) (slope of RR_A net25 = exp(−0.0055x), (b) the ratio of maximum carboxylation rate at 25°C (V cmax) to maximum electron transport rate measured at 25°C (J max) (J max : V cmax ratio measured at 25°C: slope of RR_J : V 25 = exp(−0.0057x), (c) maximum carboxylation rate at 25°C (slope of RR_V cmax25 = exp(0.0099x)), and (d) area‐based nitrogen (Na) (slope of RR_Na = exp(0.006x). Colours indicate biome (Bor, boreal in skyblue; Temp, temperate in green; Trop, tropical in black). Leaf form is represented with triangles for needleleaf and circles for broadleaf species. A response ratio > 1 indicates an increased value in warming compared with control conditions (positive response), whereas a response ratio < 1 indicates a decreased value in warming compared with control conditions (negative response). The dashed line separates positive from negative responses to warming.
