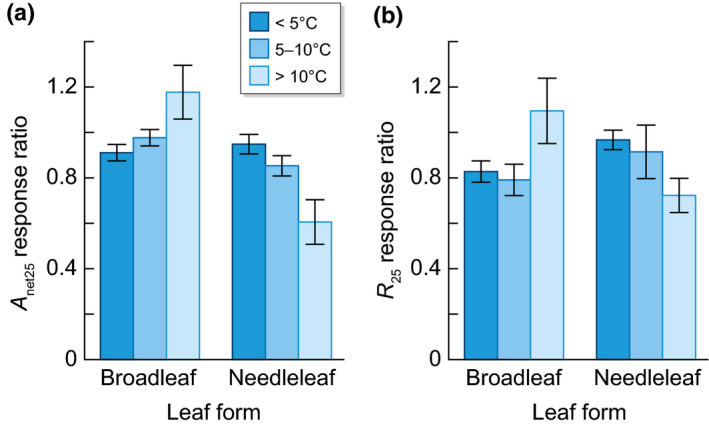
Fig. 6.

Bar plots showing the interaction between warming amount and leaf form for the mean and standard error for (a) the response ratio of net photosynthesis at 25°C (A net25) and (b) the response ratio leaf respiration at 25°C (R 25) in broadleaf and needleleaf evergreen species for three different categories of warming (< 5°C, 5–10°C, > 10°C). The interaction shows a more negative response to warming in needleleaf species with higher warming amount whereas broadleaf species had a fairly constant response and even a slight increase in R 25 with >10°C warming.
