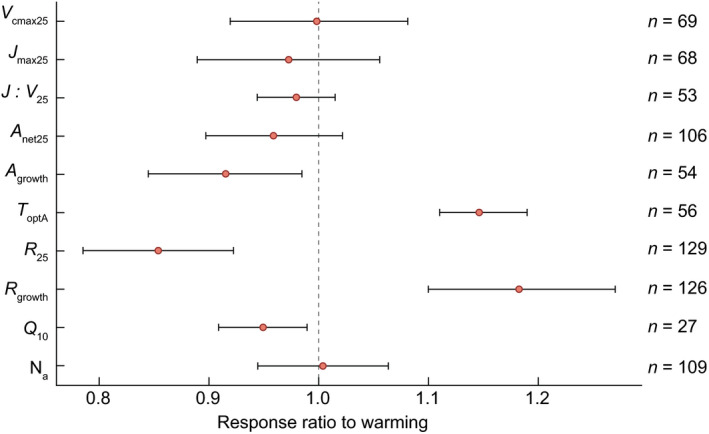
Fig. 7.

Mean (solid points) and 95% confidence interval (bars) across all evergreen species for the response ratio to warming in each of 10 variables: maximum carboxylation rate at 25°C (V cmax25), maximum electron transport rate at 25°C (J max25), the ratio of V cmax : J max at 25°C (J : V 25), net photosynthesis at 25°C (A net25) and net photosynthesis at prevailing growth temperatures (A growth), the temperature optimum of photosynthesis (T optA), mitochondrial respiration at 25°C (R 25), and dark respiration at growth temperatures (R growth), the temperature sensitivity of respiration (Q 10) and area‐based nitrogen content (Na). A response ratio > 1 indicates an increased value in warming compared with control conditions, whereas a response ratio < 1 indicates a decreased value in warming compared with control conditions (black dashed line). Overall, the response ratios of A growth (−8%), R 25 (−14%) and Q 10 (−5%) responded negatively to warming, while T optA (15%) and R growth (18%) were increased with warming. Sample sizes for each variable are indicated on the right.
