
Fig. 8.
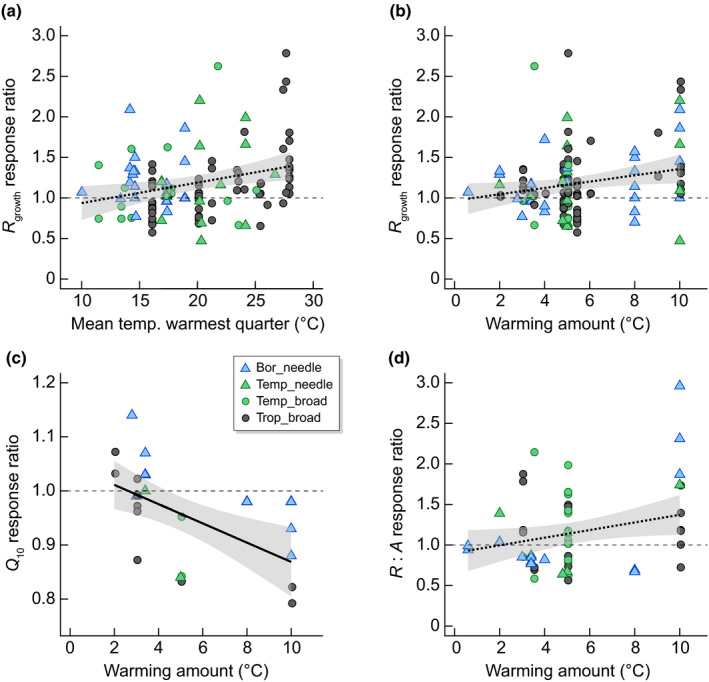
Linear regression relationships with 95% confidence intervals (grey area) between (a) dark respiration at growth temperatures (R growth) and the mean temperature of the warmest quarter (RR_R growth = 0.0252x + 0.68, R 2 = 0.05, P = 0.0083), (b) the response ratio of R growth and the amount of warming (RR_R growth = 0.039x + 0.967, R 2 = 0.03, P = 0.03), (c) the response ratio of Q 10 (where the slope parameter, Q 10, reflects the proportional increase in respiration with a 10°C increase in temperature) and the amount of warming (RR_Q 10 = 0.0178x + 1.047; R 2 = 0.30; P = 0.0028), and (d) the response ratio of R : A at growth temperatures and the amount of warming (RR_RA = 0.047x + 0.902; R 2 = 0.06; P = 0.04). The dotted lines indicate a significant but weak relationship with R 2 < 0.1. A response ratio > 1 indicates an increased value in warming compared with control conditions, whereas a response ratio < 1 indicates a decreased value in warming compared with control conditions (black dashed line separates positive from negative responses to warming). Colours indicate biome (Bor, boreal in skyblue; Temp, temperate in green; Trop, tropical in black). Leaf form is represented with different symbols with triangles for needleleaf and circles for broadleaf species.