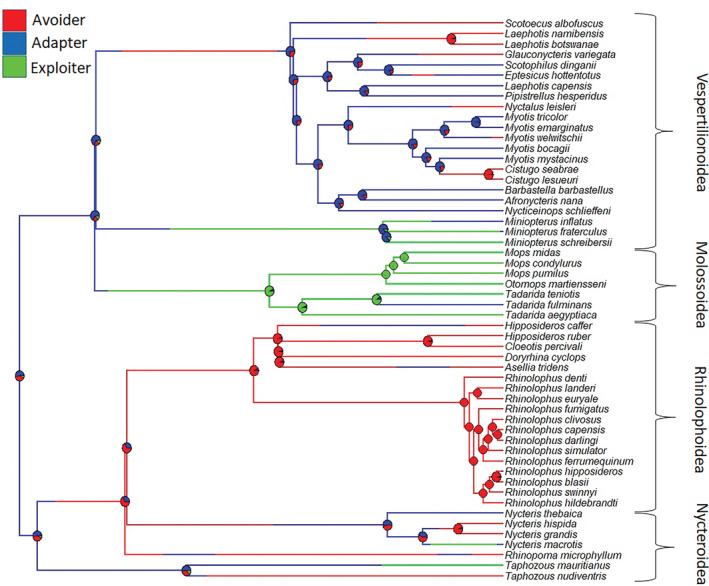
FIGURE 2.

Phylogenetic tree of African bats with known states of urban tolerance at the tips and calculated posterior probabilities for states of internal nodes. The lambda value for urban tolerance on this tree = 0.78. The probabilities of the ancestral node in each state = 0.48 for urban adapter, 0.45 for urban avoider, and 0.07 for urban exploiter. States of urban tolerance are color coded (urban exploiter = green, urban adapter = blue, and urban avoider = red). Superfamily groups are indicated on the right (after ACR, 2018).
