FIGURE 3.

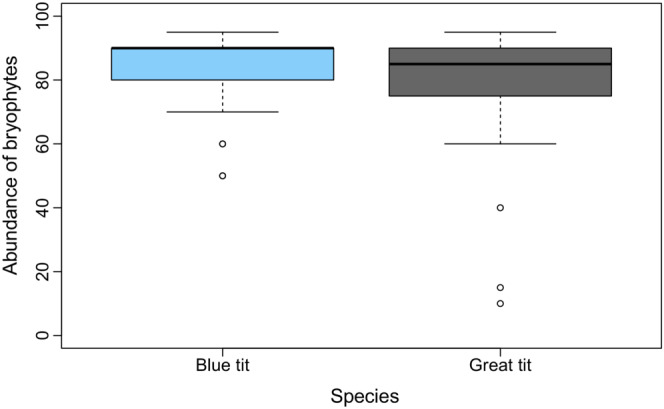
Boxplot of the abundance of bryophytes used in blue tit nests (n = 35) and great tits (n = 34). The horizontal line in each box is the median value, the box shows the interquartile range, and the dots are outliers beyond the whiskers.

Boxplot of the abundance of bryophytes used in blue tit nests (n = 35) and great tits (n = 34). The horizontal line in each box is the median value, the box shows the interquartile range, and the dots are outliers beyond the whiskers.