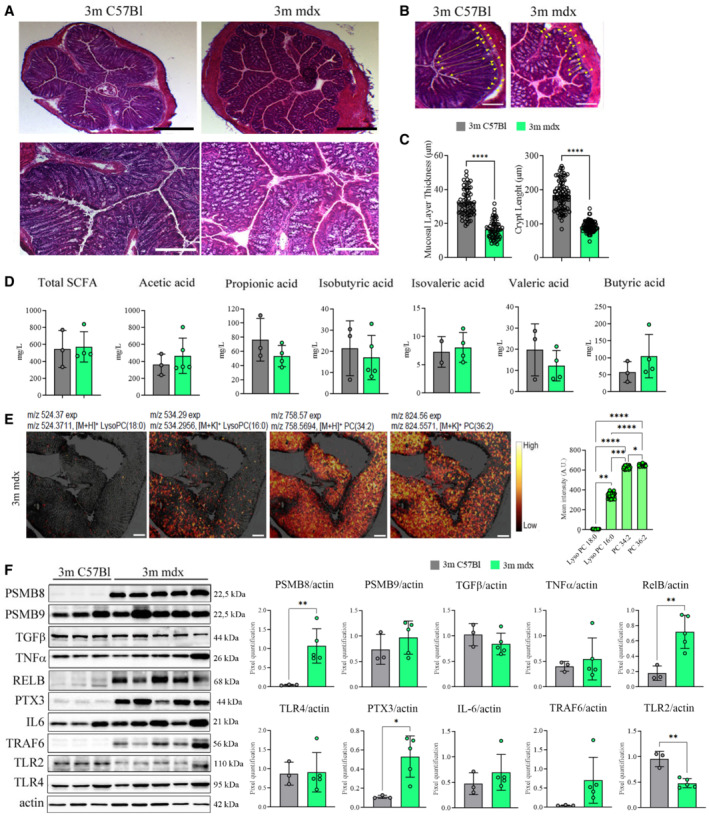
Figure 1. Colon characterization of 3m mdx mice.

- Representative images of H&E staining of colon from 3m C57Bl (n = 4) and mdx (n = 4) mice. High magnification (scale bar: 20 μm) and low magnification (scale bar: 200 μm).
- Mucus layer, area between yellow dash lines; crypt length, yellow‐headed arrow. Scale bar: 100 μm.
- Mucus layer thickness and crypt length were quantified for n = 4 mice per group (with pooled samples of n = 60 for mucus layer thickness and n = 80 for crypt length).
- Short‐chain fatty acid fecal quantification of 3m C57Bl (n = 3) and mdx (n = 4–5) mice.
- Colon images captured with the iMScope TRIO described altered pattern of expression of different phosphatidylcholines (PC) and lysophosphatidylcholines (LysoPC) (as indicated by m/z values) in 3m mdx mice (n = 3). Scale bar: 50 μm. For each lipid, the mean intensities measured at 12 positions throughout colon images are shown on the right side where bars are mean ± SEM (n = 3).
- Cropped images of representative WB showing the expression of proteins involved in inflammation and fibrosis in colon tissues of 3m C57Bl (n = 3) and 3m mdx (n = 5). Densitometric analyses of protein expression was shown as ratio to actin.
Data information: Data are presented as mean ± SD (*P < 0.05; **P < 0.01, ***P < 0.001, ****P < 0.0001; Student's t‐test).
Source data are available online for this figure.
