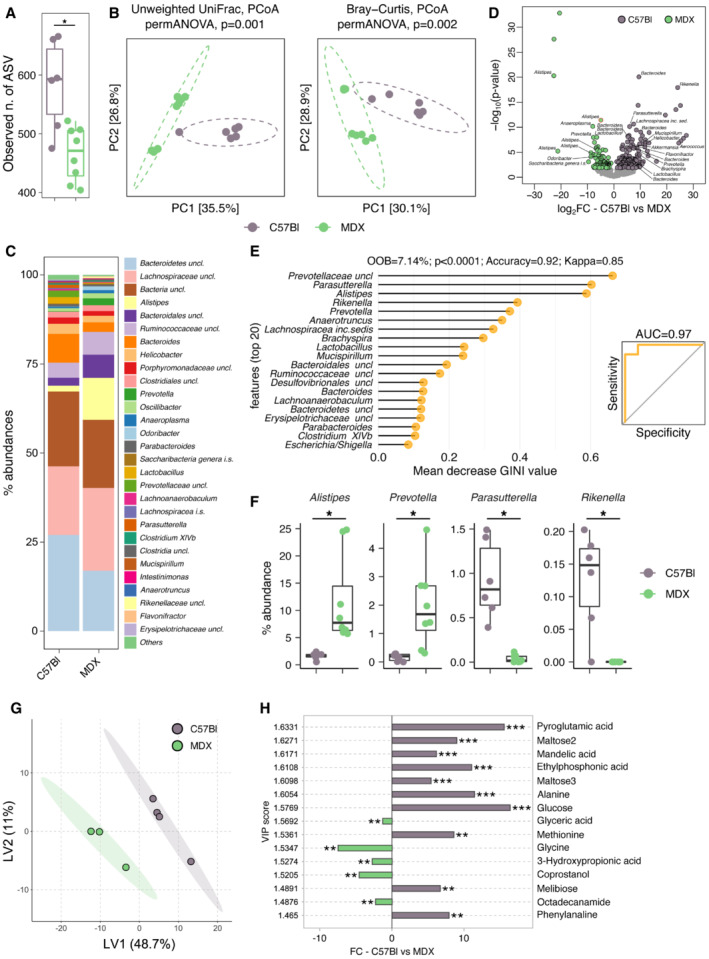
Figure 2. Microbiome analysis of 3m mdx mice.

- Observed number of enriched ASVs in 3m C57Bl (n = 6) (maximum: 666; median: 583.67; minimum: 475) and 3m mdx (n = 8) (maximum: 522; median: 465.625; minimum: 404). Data are presented as the exact number of ASVs (*P < 0.05; Student's t‐test).
- PCA of beta‐diversity of 3m C57Bl (n = 6) and 3m mdx (n = 7) as measured by Unweighted UniFrac distance and Bray–Curtis dissimilarity.
- Mean relative abundance at genus level among groups. All genera with relative abundance < 0.1% are reported together and labeled as “others.”
- Volcano plots of 3m C57Bl (n = 6) and 3m mdx (n = 7) showing the significantly enriched bacterial amplicon sequence variants (ASVs) (with P < 0.05) by the DEseq2 analysis. The names of the significantly enriched bacterial ASVs classified to the genus level and P < 0.005 are reported. All P‐values were false discovery rate–corrected.
- Random forest analysis. The top 20 bacterial genera with the highest discriminatory power sorted by mean decrease GINI value are showed.
- Relative abundance of different genus in 3m C57Bl (n = 6) and 3m mdx (n = 7). Prevotella: 3m C57Bl: maximum: 0.28438734; median: 0.162312199; minimum: 0. 3m mdx: maximum: 4.650449086; median: 1.928565583; minimum: 0.308938765. Alistipes: 3m C57Bl: maximum: 2.381488226; median: 1.622780995; minimum: 0.52990159. 3m mdx: maximum: 24.79693926; median: 11.74146327; minimum: 5.71434417. Parasutterella: 3m C57Bl: maximum: 1.491499069; median: 0.923747366; minimum: 0.390776848. 3m mdx: maximum: 0.114573317; median: 0.036571394; minimum: 0.002045952. Rikenella: 3m C57Bl: maximum: 0.202549256; median: 0.124121093; minimum: 0.067516419. 3m mdx: maximum: 0; median: 0; minimum: 0. *P < 0.05; Student's t‐test.
- Multidimensional scaling analysis of small intestinal metabolomic profiles from of 3m C57Bl (n = 4) and 3m mdx (n = 3) mice calculated by samples' distance similarities (Bray‐Curtis) with the most discriminatory metabolites (top variable importance in projection score) identified.
- Concentration of the significantly different metabolites isolated from the small intestinal content of 3m C57Bl (n = 4) and 3m mdx (n = 3) mice. *P < 0.05, **P < 0.01 and ***P < 0.001; Wilcoxon rank‐sum test.
Source data are available online for this figure.
