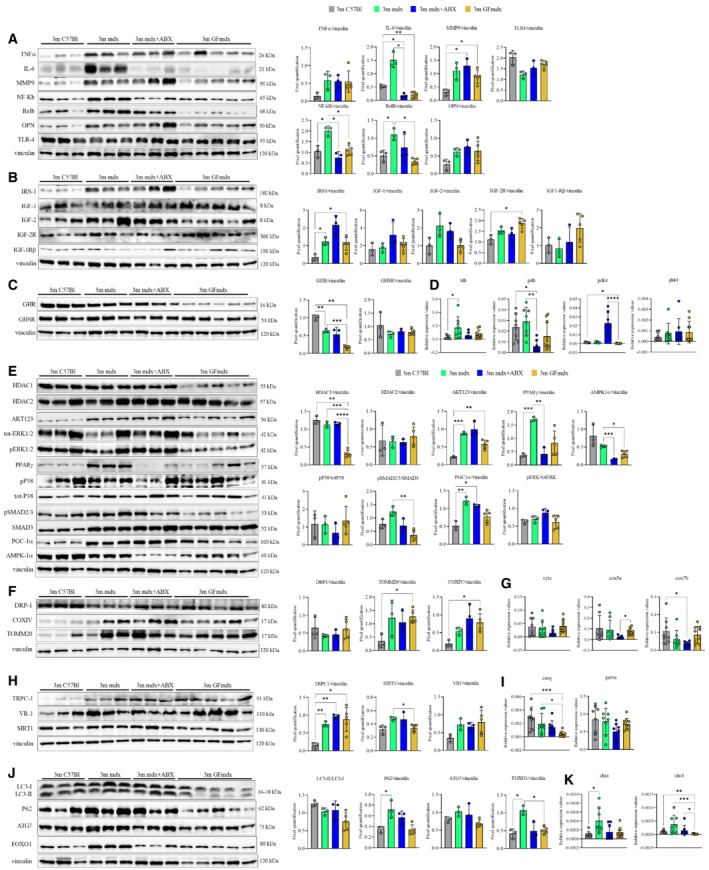
Figure EV2. Gene and protein expression in muscles from 3m mdx, mdx+ABX, and GFmdx.

-
A–KCropped images of representative WB and RT‐qPCR analysis of TA muscle of 3m mdx (n = 3/4), 3m mdx+ABX (n = 3/4), and 3m GFmdx (n = 5) showing the expression of the proteins specifically involved in inflammation/fibrosis (A), skeletal muscle metabolism (B–E), mitochondrial biogenesis (F and G), calcium conducting channels (H and I), autophagy (J), and nicotinic acetylcholine receptors (K). Densitometric data were normalized on vinculin and expressed as mean ± SD. Data are presented as mean ± SD (*P < 0.05, **P < 0.01, ***P < 0.001; ****P < 0.0001, ordinary one‐way ANOVA, Tukey's multiple‐comparison test for WB and non‐parametric test followed by Kruskal–Wallis test for RT‐qPCR).
Source data are available online for this figure.
